Test Execution Screen Default View
QA teams use the Test Suite Execution screen to run manual tests and schedule automation testing. Test suites run on different platforms and run results are recorded on this screen.
You can carry out test executions from the Default View or Detail View screen.
Executing Test Suites
To execute a test suite, perform the following steps:
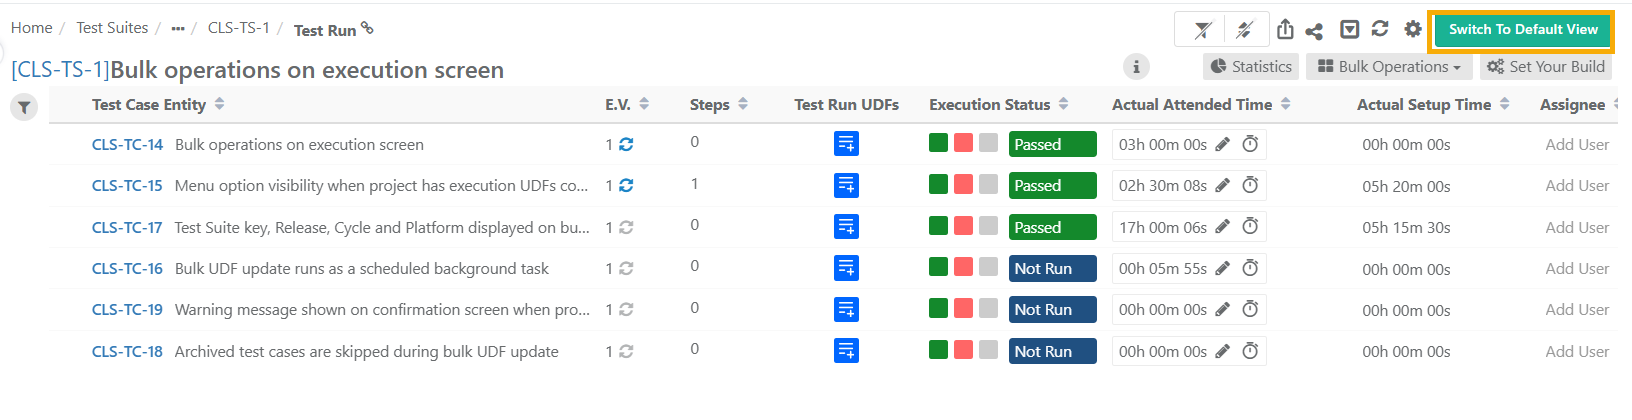 |
Go to Test Suites Detail page.
Select the Test Execution tab.
Click the Execute icon.
Click Switch to Default View.
Test Execution Screen Default View
The Test Execution screen displays the list of test cases covered under the test suite.
View, sort, and filter test cases using various parameters on the default view. This feature helps organize and streamline the test execution process.
Filtering Test Cases on Execution Screen
Filter test executions with basic and advanced filters. Refer filters to know more.
Note
Filter linked test cases in the test suite by the folder path.
View linked test cases of specific folders or the subfolder hierarchy by selecting Include entities from subfolders. By default, this option is selected.
You can filter test case executions by Test Run UDF values.
The UDF filter option is visible only when at least one Test Run UDF is defined for the project
Sorting Test Cases on the Execution Screen
Click the column headers to sort test cases on the Test Execution screen.
Organizing Columns on the Execution Screen
Customize the grid view on your execution screen by using the Arrange Column icon.
Note
View all user-defined fields, excet Large Text fields, for test cases. For test steps, even Large Test fields are supported.
For instance, you can add the Test Case Folder Path as a column to display the complete folder hierarchy of each test case.
The Test Run UDF column is visible only when at least one Test Run UDF is defined for the project.
Click the icon in the Test Run UDFs column to open a panel where you can add, edit, or deselect Test Run UDF values for that test case run.
Manage Grid Columns
View or hide the fields from the grid. Refer Managing Grid Columns to know more.
Components of the Default Execution Screen
The default execution screen displays the test cases linked to the test suite. Expand the test cases to view test step details within it.
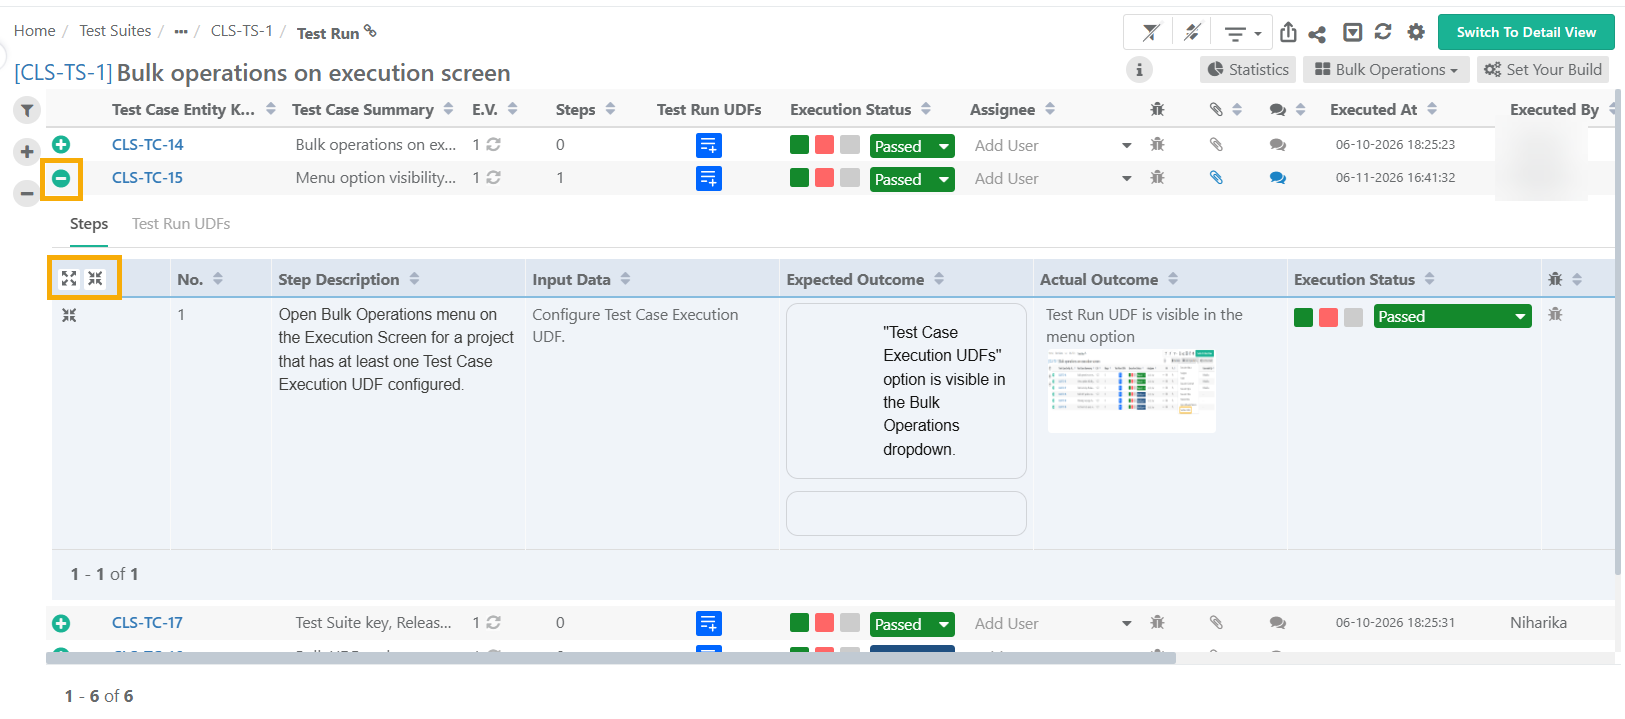 |
Click the information icon to view test suite details:
The platform against which the test is to be run.
Run Attributes: Tag Platform Attributes at run time. Read more about Tagging Attributes at Runtime in Managing Platforms.
Release: Release as selected for the test execution.
Cycle: Cycle as selected for the test execution.
Build: The Build on which the test is being executed.
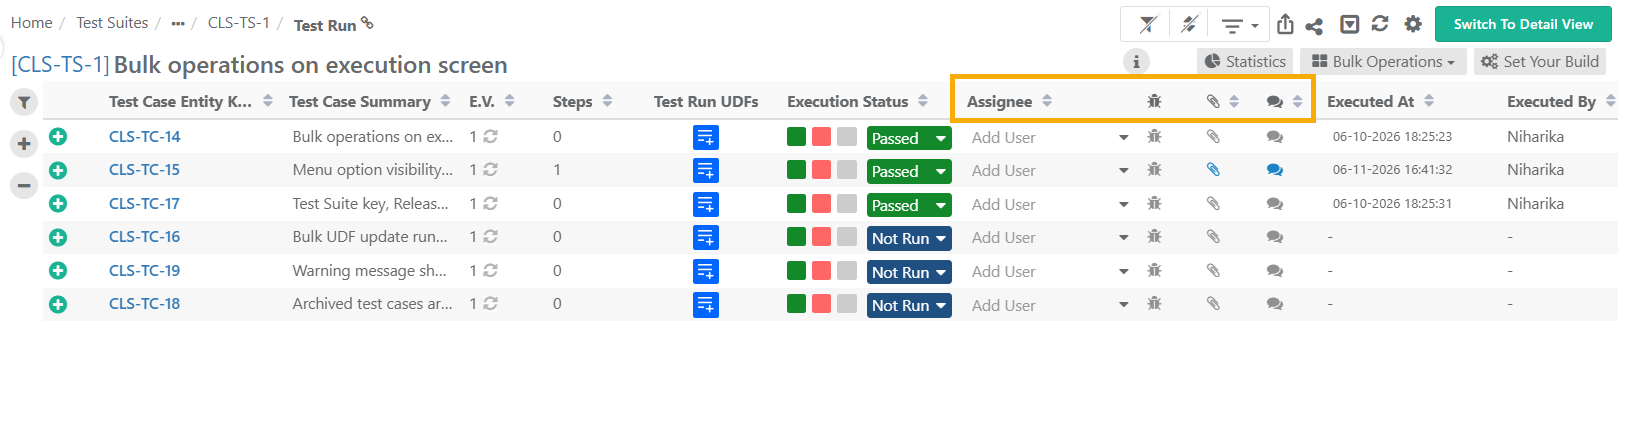 |
You can update the following parameters:
Assignee : Open the drop-down to select a user.
Issues : Click the issue icon to add or link issues. Read more about Adding/Linking Issues to Test Case and Test Step.
Comments: Add or edit remarks to test case executions and tag users using @username. Tagged users receive an email when a comment is added or updated.
Attachments: For additional information, add attachments to the test case or test steps. Add multiple remarks to test case executions and tag users using @username. Tagged users receive an email when a comment is added or updated. Refer to Managing Attachments for more details.
Test Case: Attachments added from the Test Case module. You can download the Test Case level attachments but cannot delete these attachments.
Execution: Attachments added from the Execution screen. You can download or delete these attachments added at the Execution level.
Execution Type: Mark the Execution Type as automated or manual. By default, the execution type is set to "Manual".
Planned Date: Set the planned date for test suite execution manually.
Execution At: Add or modify the execution time and date from the Execution At column.
Note
To set execution time manually, the admin must configure the following settings:
Go to Administration and select General Setting.
Go to the Edit Execution Time section.
Set the Allow Manual Edit of Last Executed Date or Time flag to On.
The Executed At field is editable only if this flag is turned On.
Change Date and Time at two levels: Individual test cases and bulk test cases through Bulk Operation.
To knowc more, refer to Calculating Execution Time and Remaining Time.
Set Up Vs Attended Time
Enter Actual Setup Time and Actual Attended Time for each test case on the execution screen. Refer to Tracking Actual Execution Time with Stopwatch Timer to know about timer settings.
Test Run UDFs Tab
The Test Run UDFs tab lets testers capture custom execution details for an individual test case run. These fields are defined at the project level and specific to each execution run.
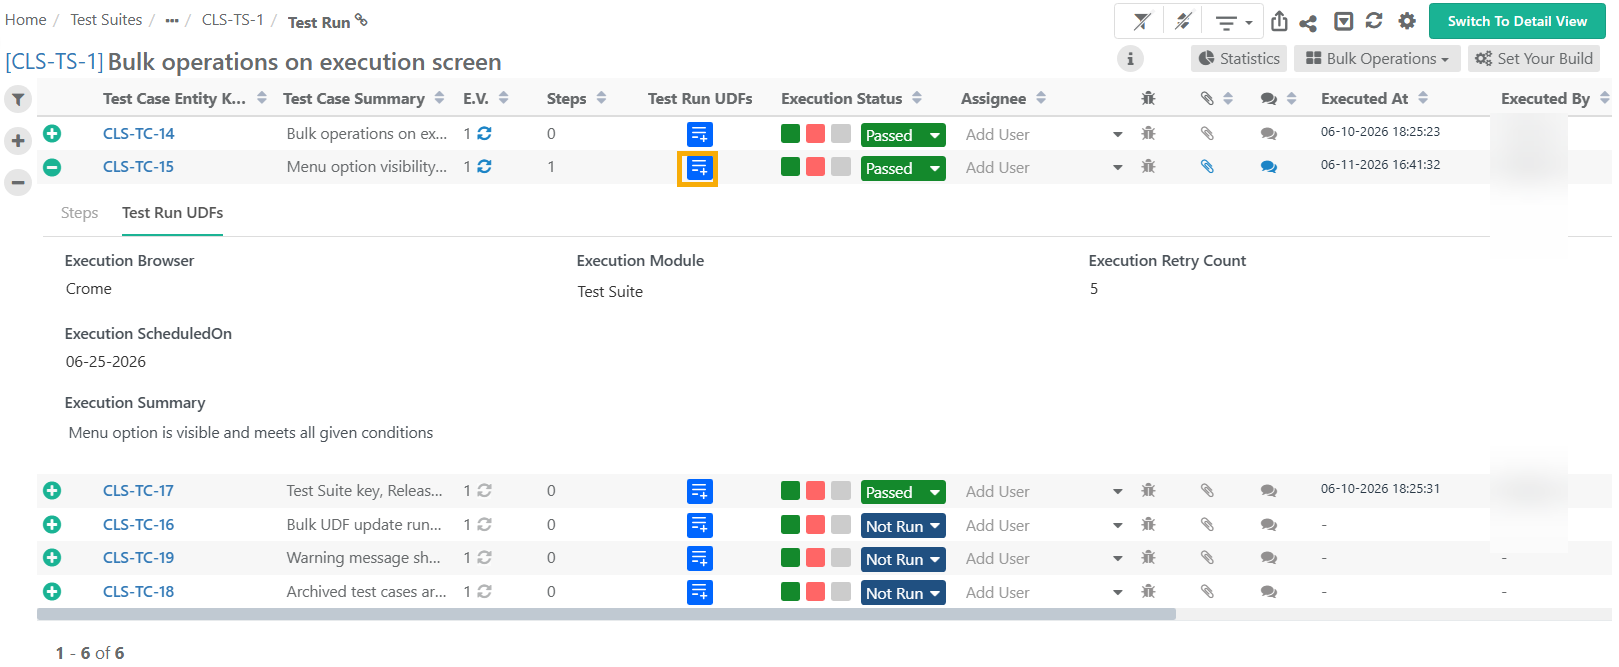
The tab appears in the tab row only when the project has at least one Test Case Execution UDF configured.
When you open the Test Run UDFs tab, QMetry displays all Test Case Execution UDFs configured for the project. Mandatory and optional fields are clearly labelled.
Note
When a test suite includes test cases from other projects, QMetry displays UDFs based on the project of the Test Suite, not the project the test case belongs to.
Updating Test Run UDFs
To fill in Test Run UDFs for a test case run:
Open the test case execution and go to the Test Run UDFs tab.
Enter or select values for the fields you want to fill in.
QMetry saves values as you enter them. No separate save action is needed.
You can add, edit, and deselect values at any point during the execution run.
Test Run UDFs cannot be edited when the execution is archived or the project is under eSignature review or closed state.
QMetry records all details related to UDF updates in the Change Log tab.
For eSignature Enabled Projects
When you enable eSignature, the Test Suite Execution status determines whether UDFs are editable.
Approved: UDFs are editable. The Test Run UDFs option is available in Bulk Operations.
In Review or Closed (at any level): UDFs are read-only.
For Part 11 Compliance Enabled projects
When you enable Part 11 Compliance, you do not need to authenticate credentials to update Test Run UDFs.
Execute Individual Test Cases
Execution Status of test case and test step depends on the Derive Test Case Execution status from Test Case step status settings in the Project module. The settings remain “On” by default, which derives test case execution status from test case step status and vice versa.
Disable auto-deriving execution status from Project Settings. Refer to Project Management for more details.
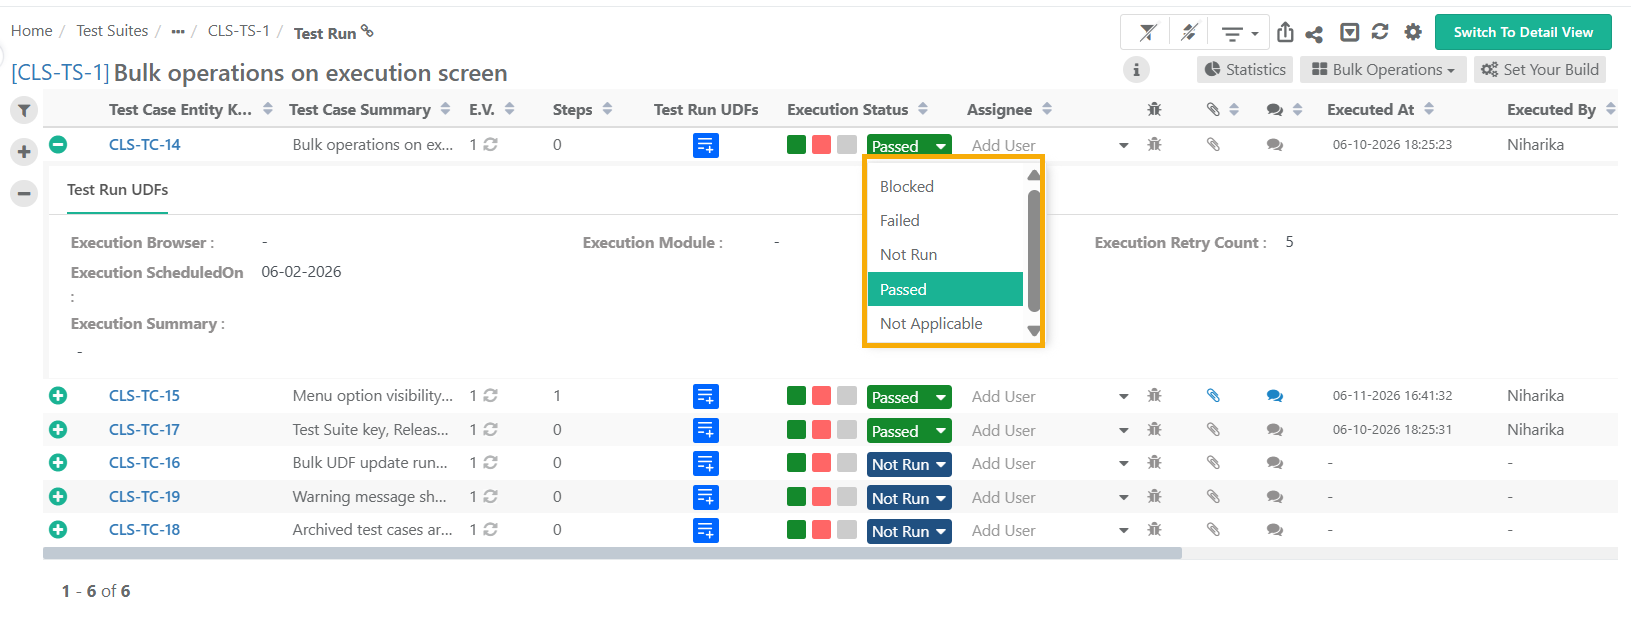 |
Derive Test Case Execution Status from Test Case Step Status: On - The system derives the test case execution status from test case step status and vice-a-versa as per the set priority of Execution Status in Execution Status Management.
Derive Test Case Execution Status from Test Case Step Status: Off - You need to manually change the status of the test case.
To execute test cases in bulk, refer to bulk operations on test executions.
Execution Status of Test Cases with Parameterized Values
View the execution status at the parameter group combination level when executing parameterized test cases on the execution screen.
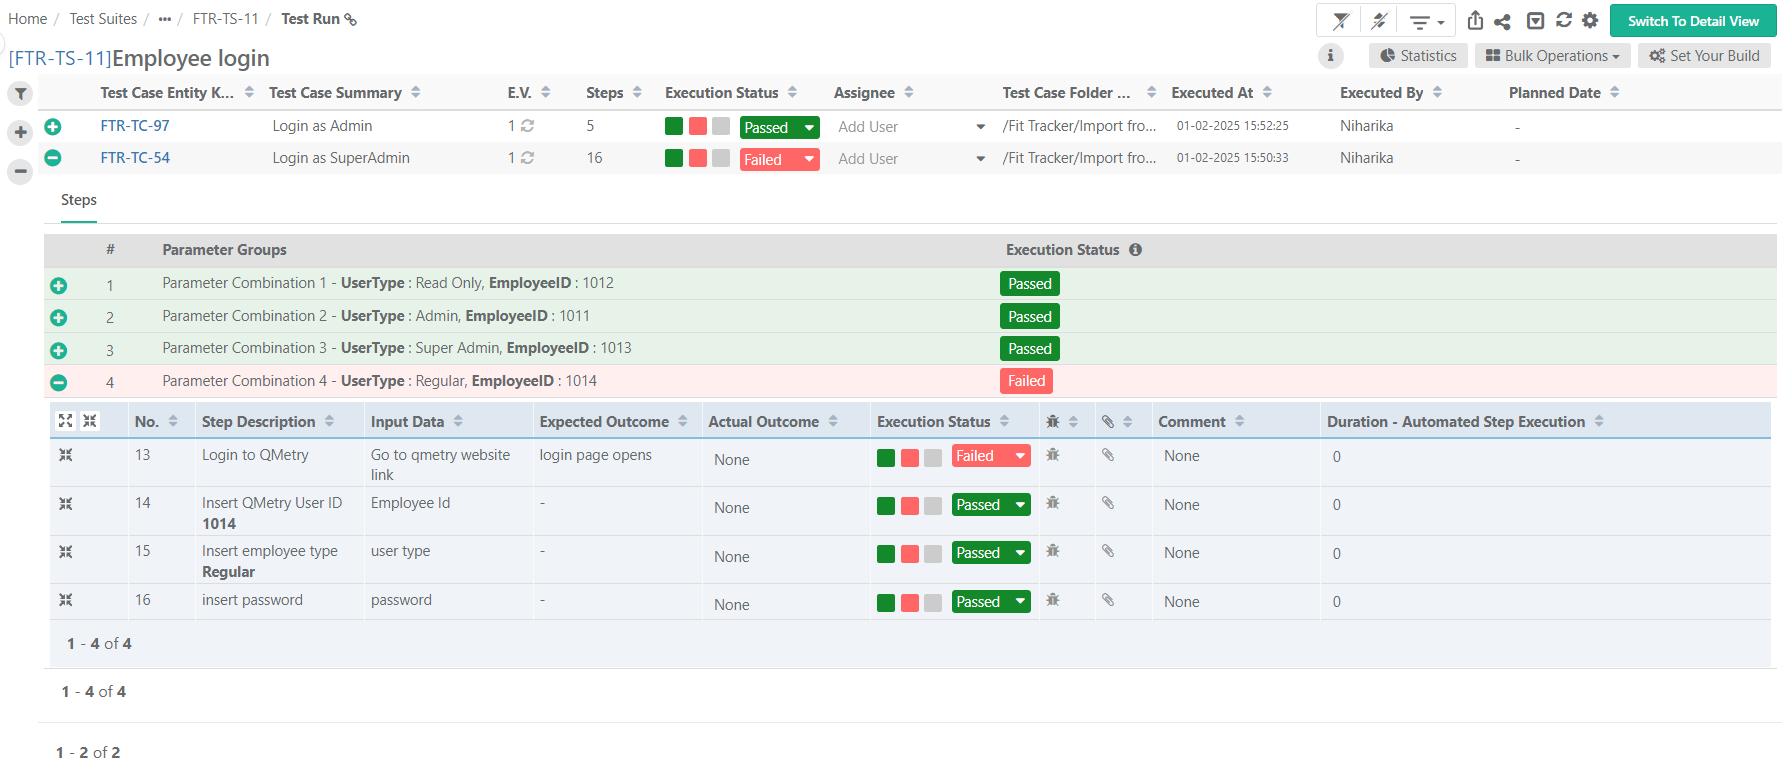 |
As a tester analyzing a failed test case execution with multiple parameter group combinations, you can identify the failed parameter combinations or unexecuted cases with a "Not Run" status.
Note
Enable Derive Test Case Execution Status from Test Case Step Status setting to display the execution status for parameter groups
The system displays only consolidated execution status for each parameter group. This execution status is not editable.
The execution status of each parameter combination follows the similar status prioritization logic used to calculate the test case execution status. Refer Execution Status Management to know more.
View Execution Statistics
To view execution statistics, perform these steps:
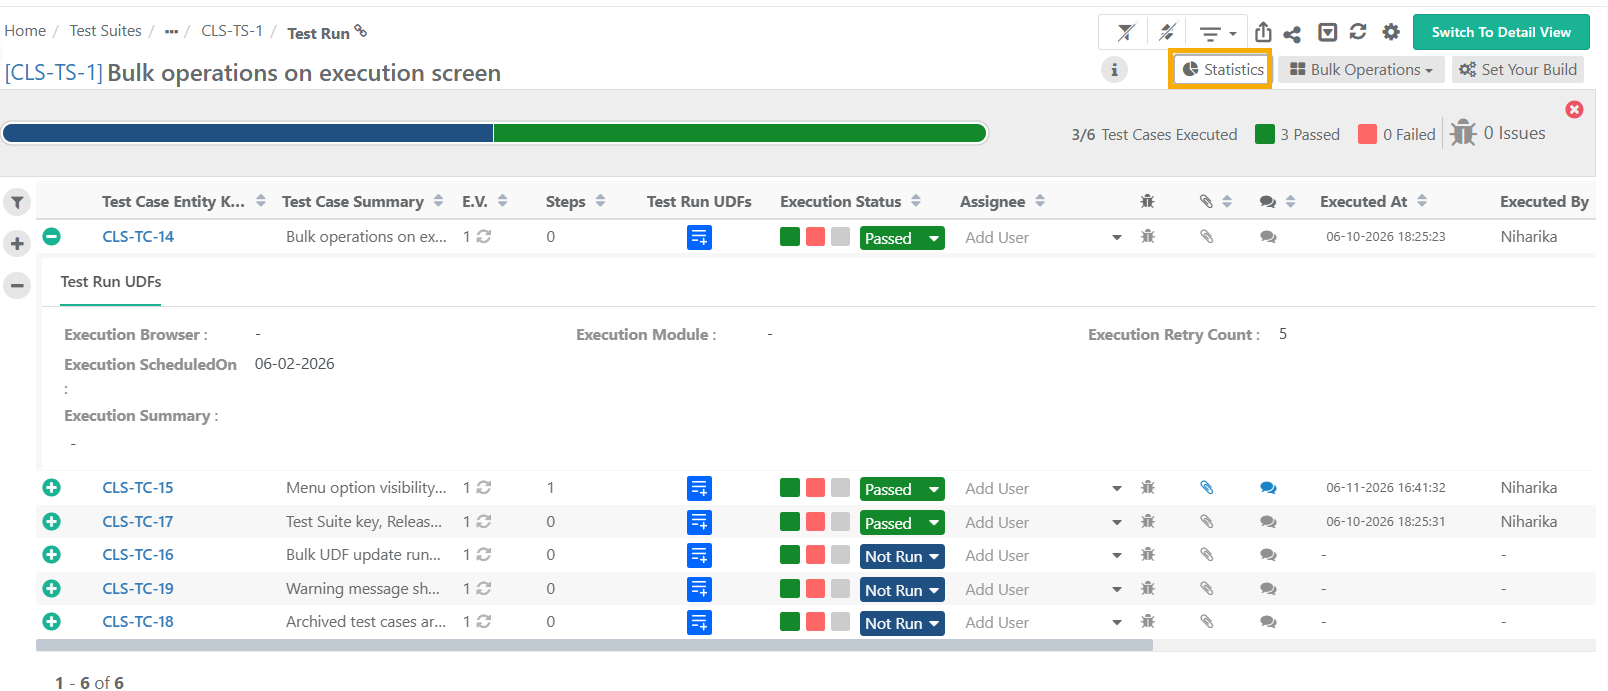
Go to the Test Execution Default View.
Click Statistics.
Note
The system generates the status bar based on the status of each test case execution (i.e., Not Run, Passed, Failed, Blocked, Not Applicable, any other user-defined status).
Creating New Build
To create builds from the Execution screen, perform these steps:
Click .
Select the test cases to apply the build and select the build from the drop-down.
Click to open Builds section under Projects in another tab. Refer to Managing Builds to know more about adding a new build.
Link Latest Test Case Version at Run-time
From the Execution screen, sync the test case to associate its latest version with the test suite.
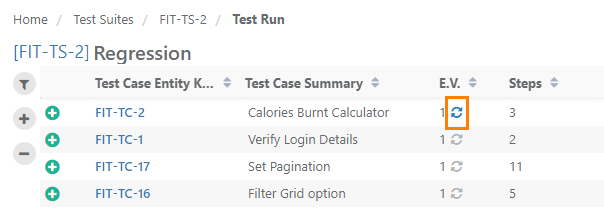
When a test case is updated to a new version that is not associated with the execution, the Version field shows a blue Refresh icon.
Sync a Single Test Case to Latest Version
Click Refresh to update the test case version to the latest one.
Note
The execution status of the updated test case is reset to Not Run.
 |
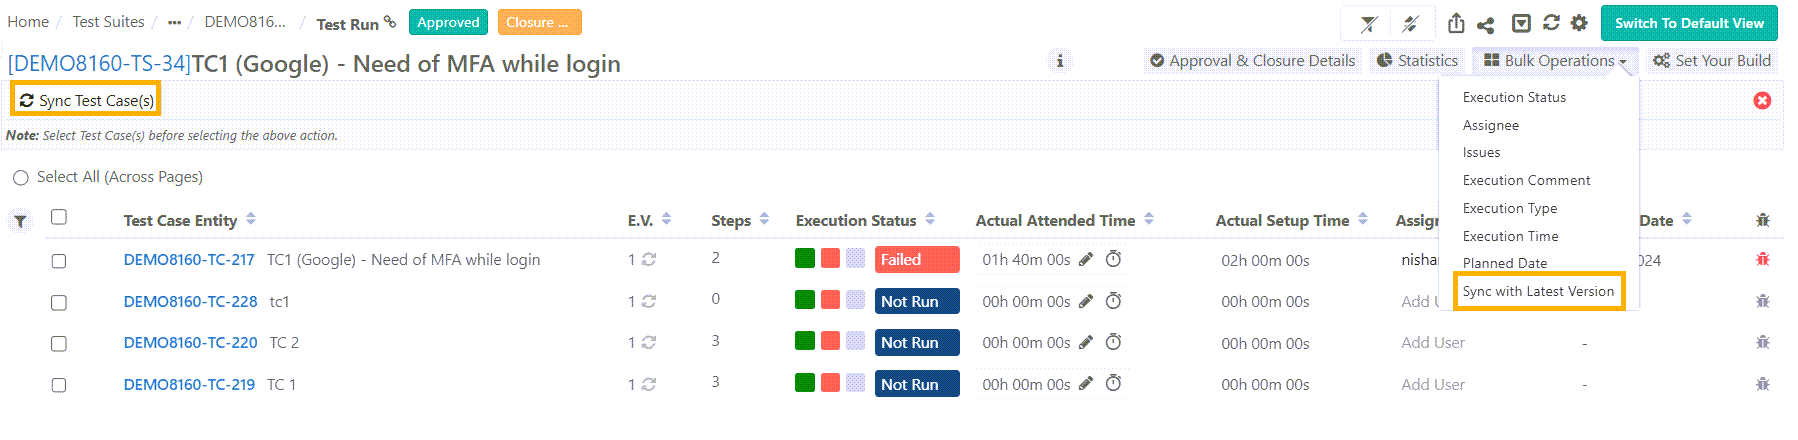
Bulk Sync Test Cases to Latest Version
To sync multiple test cases to their latest version, perform these steps:
Open the drop-down menu and select Sync with Latest Version.
Select the test cases to sync.
Click .
 |
Logs
Test Result Logs
Test Result Log provides detailed information for each test and their execution and outcomes.
Change Log
Track the changes done at the execution level from Change Log.
When a test step is modified, the system shows its details in the Action column, helping users track which step changed.