Test Execution Screen Detail View
The Detail View of execution screen shows the test case execution details grouped in different tabs on a single screen. You can change the sequence of the tabs through drag and drop. QMetry saves this tab sequence per user.
Test Execution Detail View
To open the test execution detail view, perform these steps.
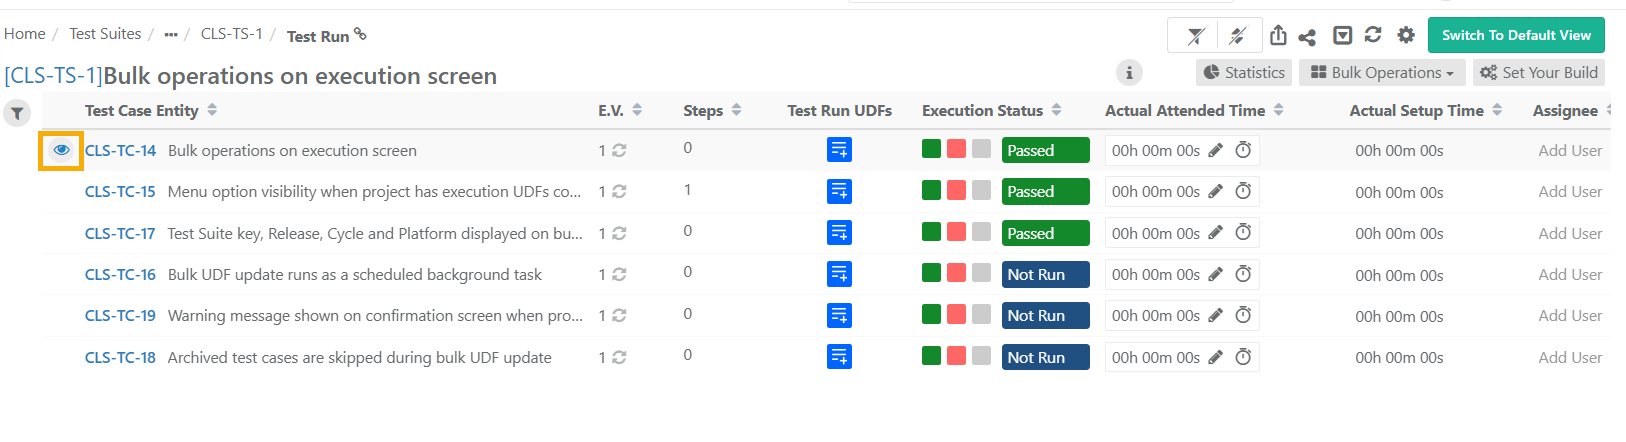
Go to the Test Suite module and select Test Suite Entity Key.
Select the Execute icon in the Test Execution tab.
Hover over the Test Case Entity Key and click the eye icon.
This displays the Execution details in different tabs.
Note
The Test Run UDF column is visible only when at least one Test Run UDF is defined for the project. Click the icon in the Test Run UDFs column to open a panel where you can add, edit, or deselect Test Run UDF values for that test case run.
Test Run Detail View
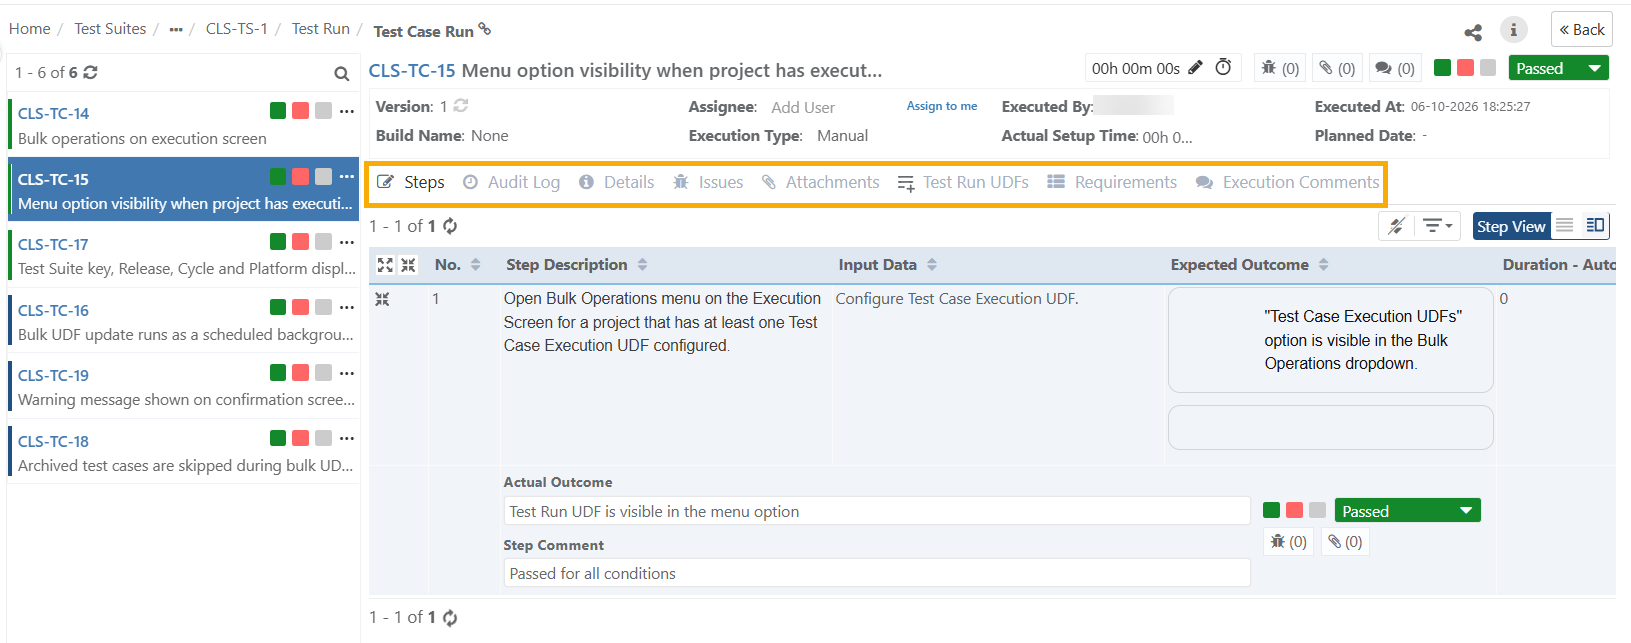
On the Test Run Detail View, the left panel lists the test cases linked to the test suite. Click any test case in the panel to load its execution details on the right.
The right side shows the selected test case run. The tab row includes Steps, Details, Issues, Attachments, Test Run UDFs, Requirements, Execution Comments, and Audit Log.
Left Panel
The left panel lists all test cases linked to the test suite and lets you navigate between them.
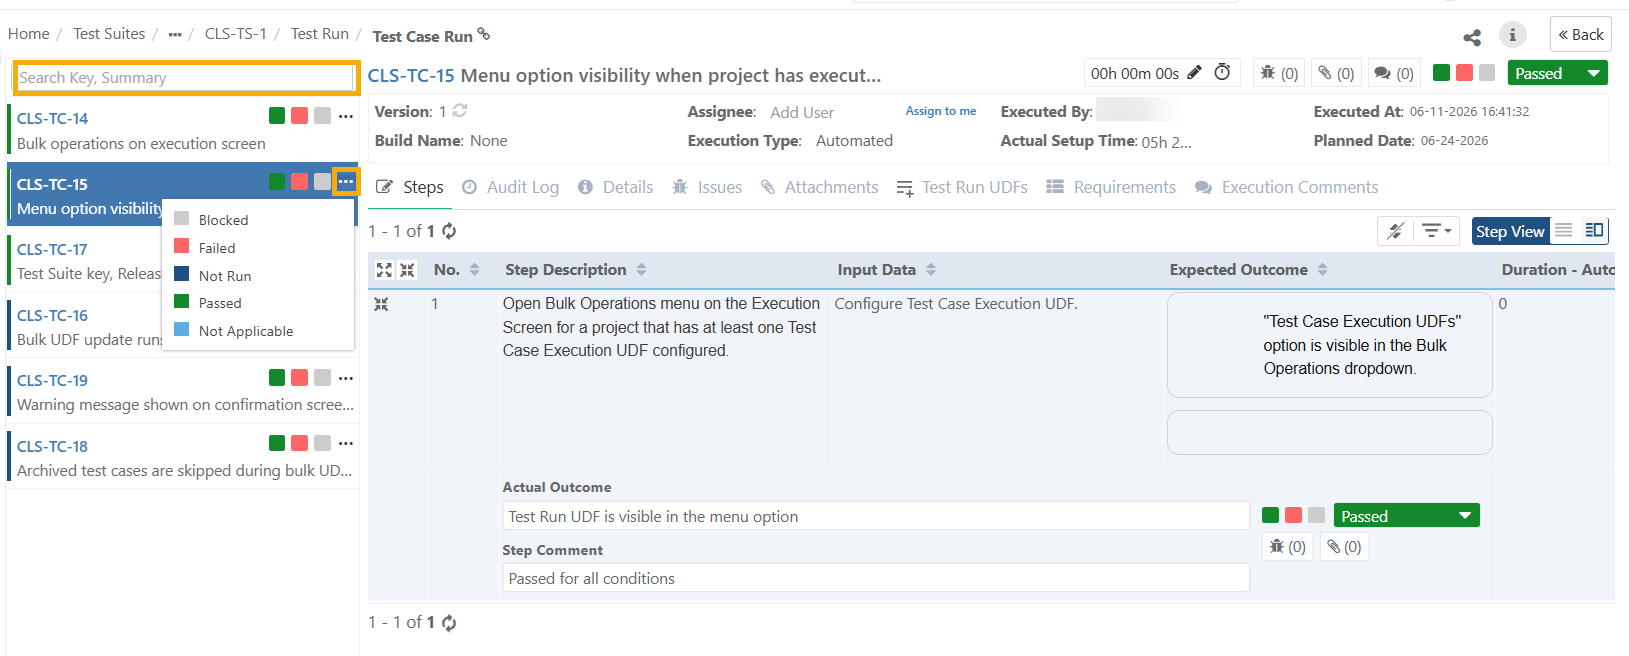
Search: Hover over the search key at the top to search test cases by Key or Summary
Execution Status: Update Execution status of a test case by clicking on the three dots.
Right Panel
The right panel displays the execution details and controls for the selected test case.
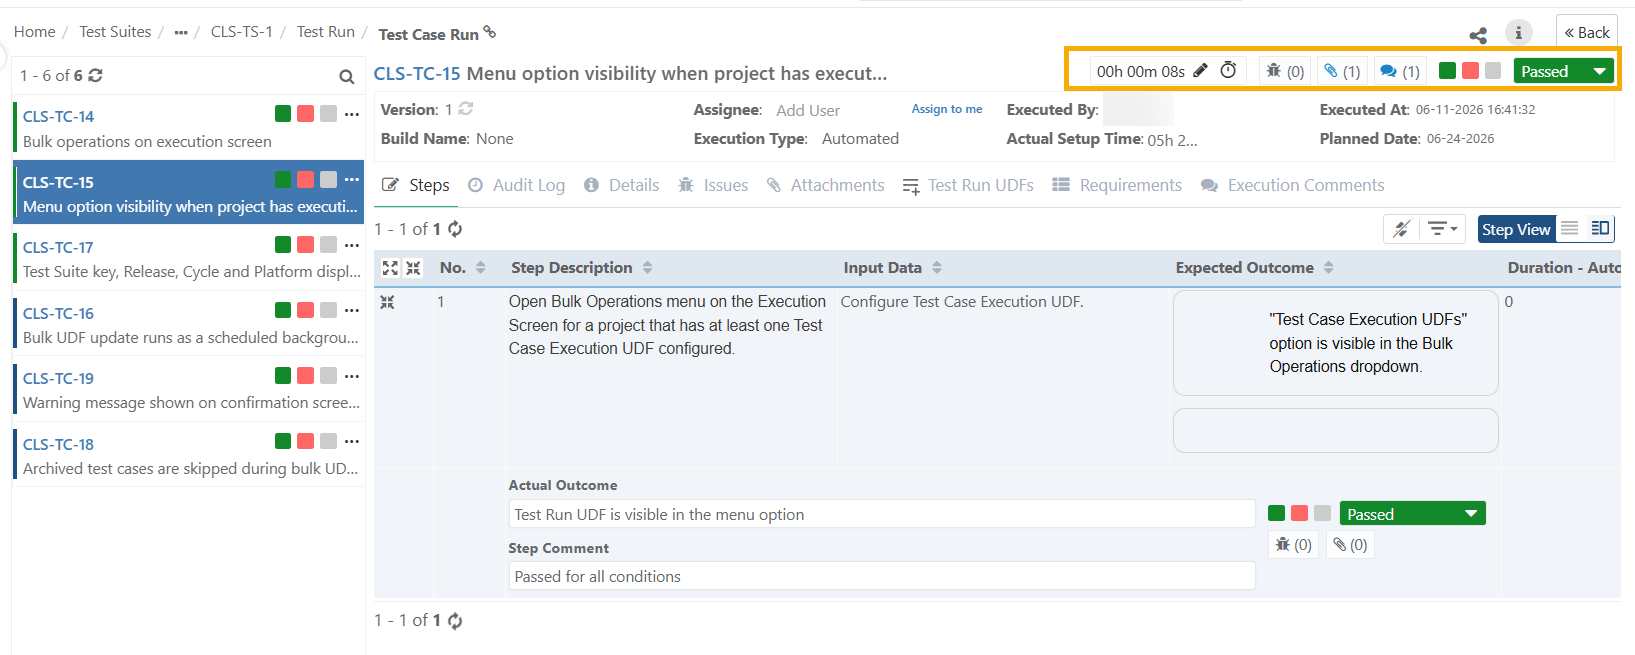 |
Run Stopwatch Timer: Click the Edit icon to update execution time manually or click the click icon to run stopwatch timer.
Issues Count: Displays number of bugs for the execution. Clicking the icon opens the Issues tab.
Attachment Count: Displays number of attachments for the execution. Click the icon to open the Attachment tab.
Comments Count: Displays number of comments for the execution. Click the icon to open the Comments tab.
Set Execution Status: Click the execution status to set the execution status manually.
View Options
Use these options to control how test cases and columns appear on the execution screen.
Clear Sorting: Sort test cases on the Test Execution screen by clicking on the respective column headers. Click Clear Sorting to clear this sorting.
Arrange Columns: Show or hide columns on the detail view from Arrange Columns.
Step View: View step details.
Run Details
These fields display the key metadata for the current test case run.
Build Name: The drop-down shows values entered in Builds under Projects.
Assignee: Assignee assigned from the execution screen.
Executed By: User who executed the test case.
Actual Setup Time: The actual time required to set up the test case.
Actual Attended Time: The actual time taken to execute the test case.
Execution Result: The result of the execution.
Filters: Filter test executions with basic and advanced filters. Refer Filters to know more.
Platform Attributes: If you have tagged Platform Attributes for runtime, you can edit Runtime Attributes in the detail view. You can provide attribute values either at run time or afterward.
Test Run View
The Test Run details show execution detail in separate tabs.
You can change the sequence of the tabs through drag and drop operation. The preferences are saved as per each user.
|
Steps Tab
View the steps in List View or Grid View.
Steps View in List View: View step details organized vertically.
Steps in Detail View: View step details in a row.
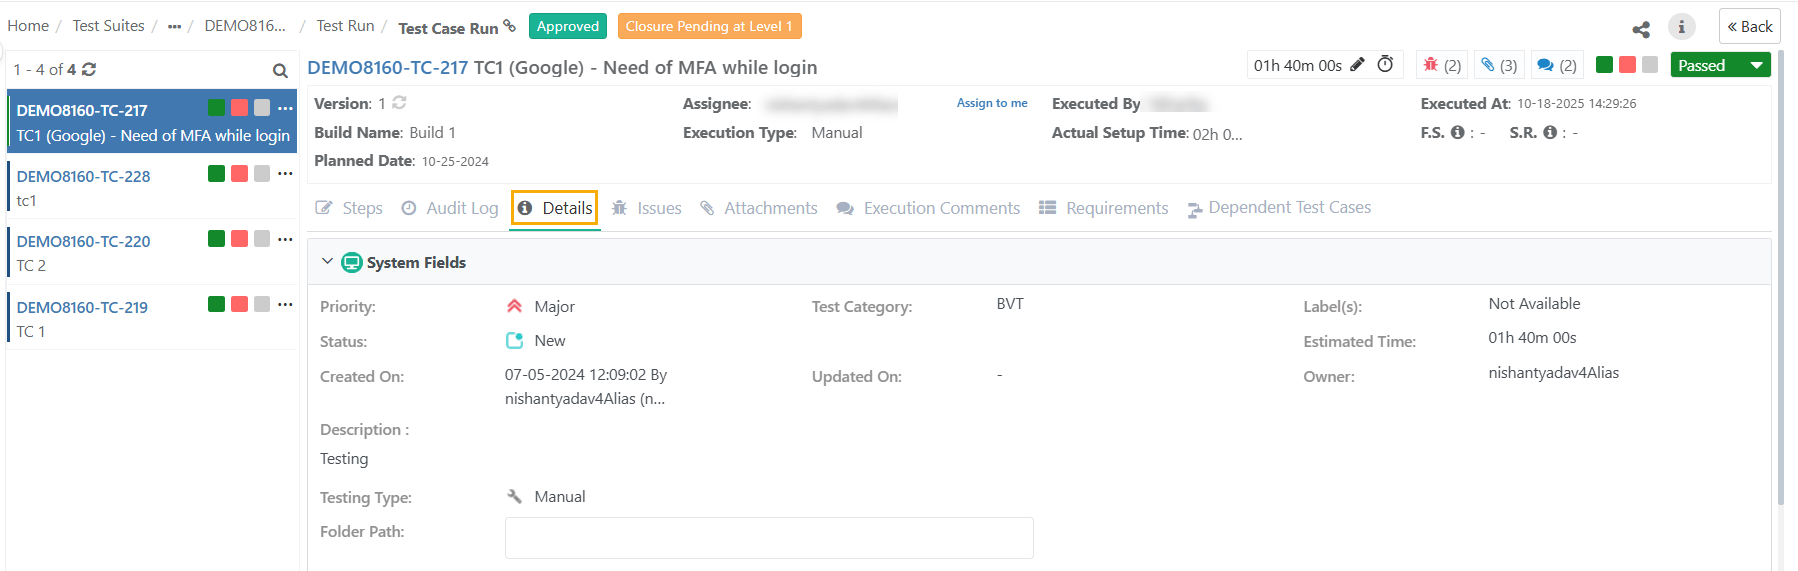
Details Tab
Detail View of the execution screen displays test case details.
 |
Requirements Tab
The Requirements tab enables testers to view requirements associated with the test case under execution.
Issues Tab
Create a new issue or link existing issues to the test case. View linked issues to the test case in this tab. The Linkage Level displays whether the issue is logged at the test case level or test step level.
Read more details on Link Issues/Bugs/Defects on Detail View Execution Screen.
Attachments Tab
The Attachments tab lists all the attachments added from the Test Cases module as well as from the execution screen. You can filter attachments based on their Attachment Level.
Read more details on Add Attachments on the Detail View of Execution Screen.
Execution Comments Tab
Write execution remarks in the Execution Comments tab. Tag QMetry users in the Comments sections by @username. The system triggers an email notification to the tagged user.
Audit Log Tab
The Audit Log tab consists of two sections: Test Result Log and Change Log.
Test Result Log: The section displays test execution log for the test case. Expand the test case and drill down to view the steps.
Change Log: The section records the change log for that particular test case.
Test Run UDFs Tab
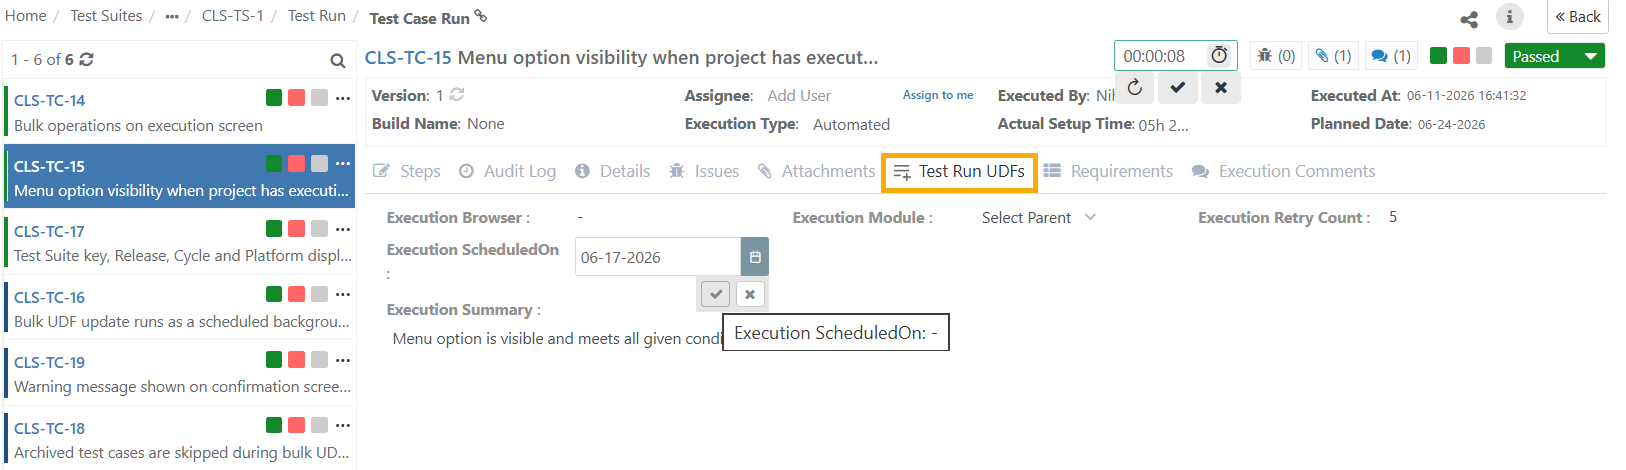 |
This tab appears only when the project has at least one configured Test Run UDF.
When you open the Test Run UDFs tab, QMetry displays all Test Run UDFs configured for the project.
Note
When a test suite includes test cases from other projects, QMetry displays UDFs based on the project of the Test Suite, not the project the test case belongs to.
Updating Test Run UDFs
To fill in Test Run UDFs for a test case run:
Open the test case execution and go to the Test Run UDFs tab.
Enter or select values for the fields you want to fill in.
QMetry saves values as you enter them. No separate save action is needed.
You can add, edit, and deselect values at any point during the execution run.
Test Run UDFs cannot be edited when the execution is archived or the project is under eSignature review or closed state.
QMetry records all details related to UDF updates in the Change Log tab.
For eSignature Enabled Projects
When you enable eSignature, the Test Suite Execution status determines whether UDFs are editable.
Approved: UDFs are editable. The Test Run UDFs option is available in Bulk Operations.
In Review or Closed (at any level): UDFs are read-only.
For Part 11 Compliance Enabled Projects
When you enable Part 11 Compliance, you do not need to authenticate credentials to update Test Run UDFs.
Test Case Run Detail View
Assign Execution Status
Assign Execution Status at Test Case or Test Step Level.
Assign Status to Test Case
To assign status to a test case, perform these steps:
Go to the Test Case Details Page.
Click Execution Status icon and set the execution result.
The panel on the left displays the test cases associated with the test suite. Click the result icon to set test case result.
Assign Status to Test Step
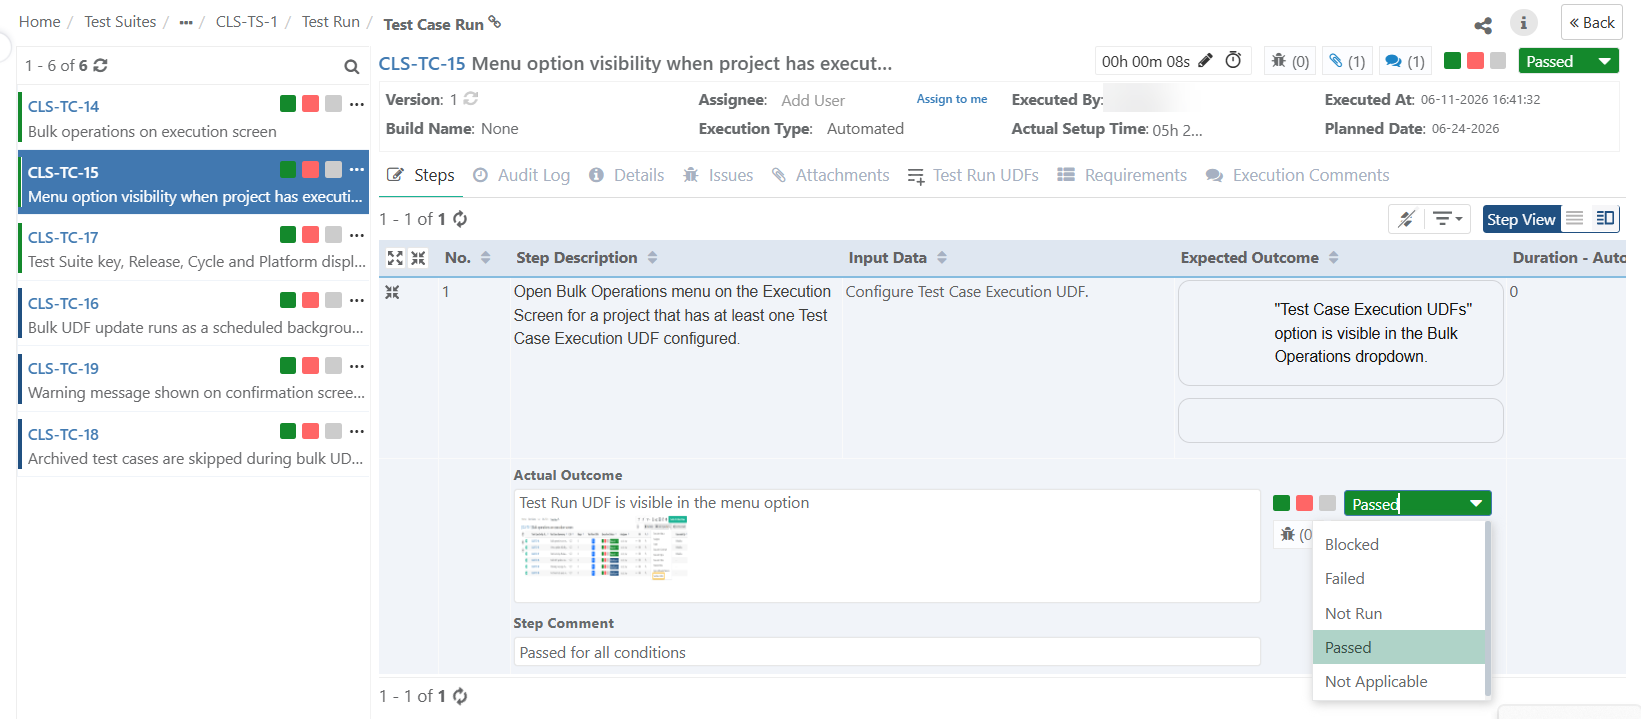 |
Open the Steps tab and assign the status to the step. Link issues and attachments at test step level by clicking on the respective icons.
Execute Individual Test Cases
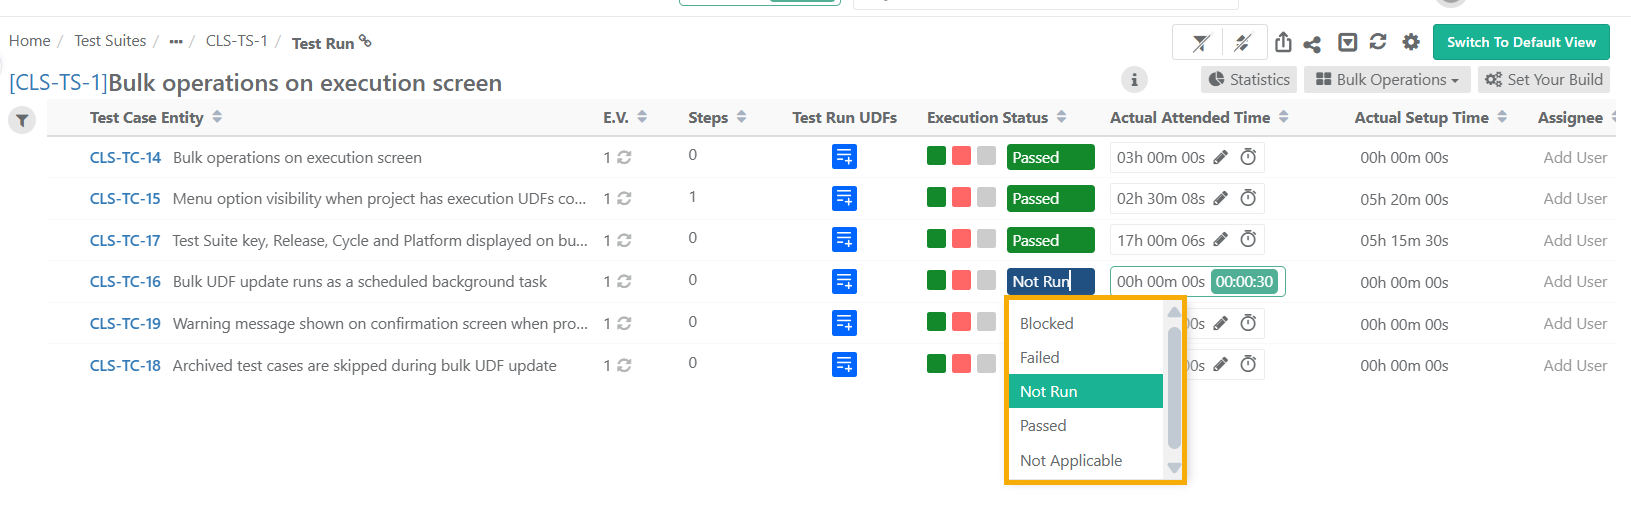 |
Select the execution status for the test case under the Execution Status column.
Execution Status of Test Cases with Parameterized Values
The execution screen displays the execution status at the parameter group combination level when executing parameterized test cases.
As a tester analyzing a failed test case execution with multiple parameter group combinations, you can identify both the failed parameter combinations and unexecuted cases with a "Not Run" status.
Note
Projects with the “Derive Test Case Execution Status from Test Step Status” setting enabled display the execution status for parameter groups.
The system displays only the consolidated execution status for each parameter-group combination based on the test step execution. You cannot edit this execution status.
The execution status of each parameter combination follows the similar status prioritization logic used to calculate the test case execution status. Refer Execution Status Management to know more.
Actual Attended Time (mins)
Enter Actual Setup Time and Actual Attended Time for each test case on the execution screen. Refer to Tracking Actual Execution Time with Stopwatch Timer document to know about timer settings.
Bulk Operations
Refer to Bulk Operations on Test Executions
Linking The Latest Test Case Version at Run-time
Note
Linking retains the Values of Test Run UDFs
Refer to Test Execution Screen Default View for more details.
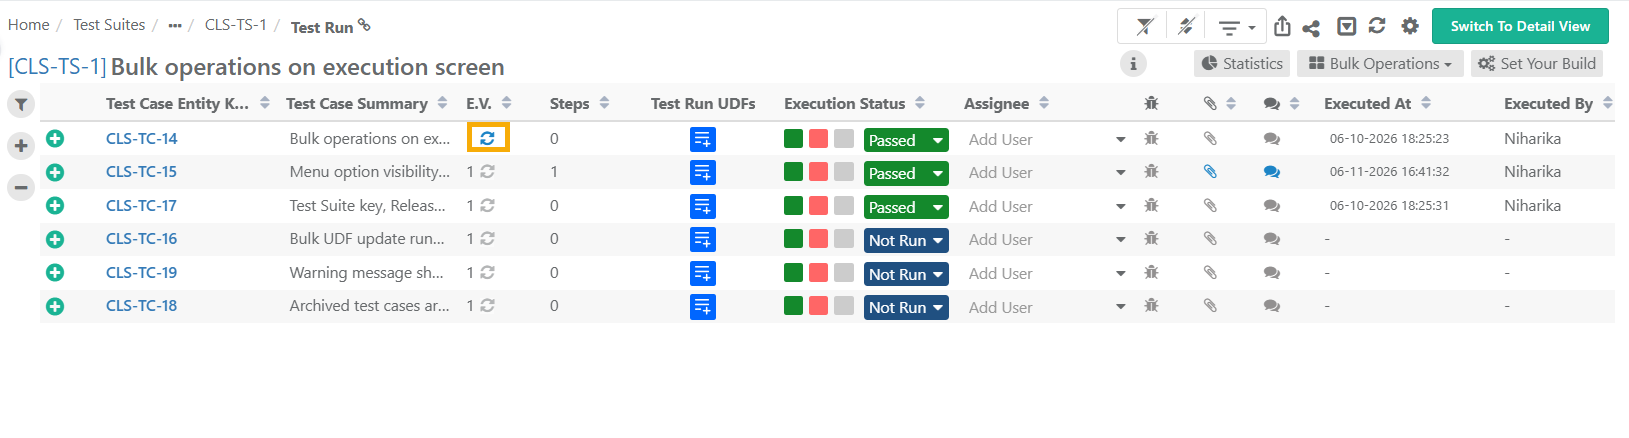
Sync a Single Test Case to the Latest Version
 |
Test Result Log
Test Result Log provides detailed information for each test and their execution and outcomes.
Change Log
Change Log displays activity logs on the execution screen for a particular Test Execution.