Visual Reports
QMetry Insight provides interactive reports that let you drill down into data, navigate, filter, sort, and view detailed insights.
Visual Reports are designed for business users without technical expertise. You can visualize, design, and create custom reports by dragging and dropping module-level data fields. Add filters and attributes, and produce personalized reports.
Pre-requisites
Before you use Visual Reports, confirm the following:
You have View and Modify rights for QMetry Insight.
You know which QMetry module contains the data you want to report on.
If you need custom field data from Jira or Azure integrations, confirm that Sync Fields to Reports is turned on in your project settings.
Go to Integrations Tab within Integration to verify.
Test Entities View
Test Entities view is divided into five sections, each representing a QMetry module -
Issues
Requirements
Test Cases
Executions
Test Suites
Select a module to display the corresponding entity fields. For example, selecting Test Cases shows all Test Cases fields.
Test Entity Fields
Every field in the Test Entities view belongs to one of three types. The field type icon next to each field name identifies which type it is.
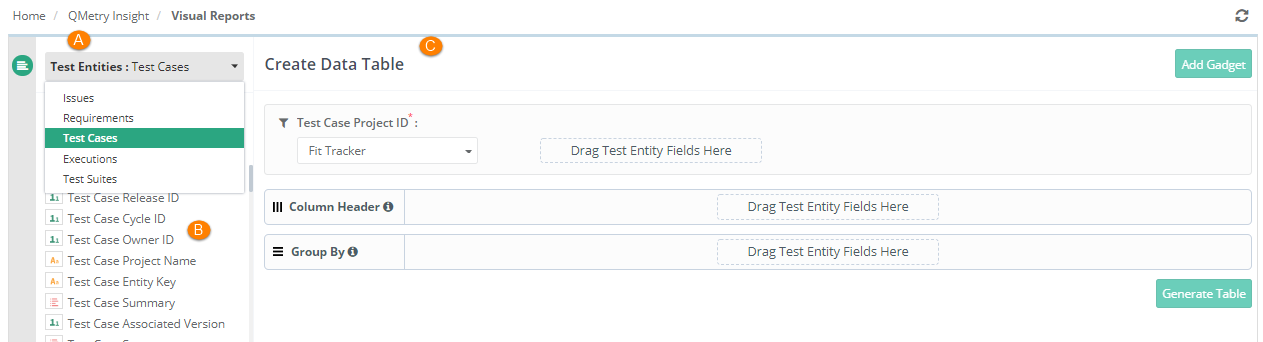 |
ID Fields (Denoted as A): Numeric fields that do not appear on screen. Used primarily for dynamic filters like Project ID, Release ID, and Cycle ID.
System Fields (Denoted as B): Fields that are visible on screen and appear in the report output. Example, Project Name and Release Name.
Custom Fields (Denoted as C): Fields prefixed with qmetry. (internal) or ext. (external) custom fields.
To locate fields, use the search bar at the top of the Test Entities view.
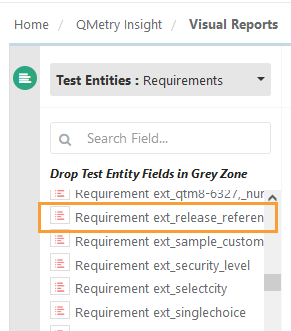
For example, an external custom field “Release Reference” is mapped with the Requirement module. This field is synced in the QMetry Insight tables using the Sync fields to Reports feature. The system displays this field as “Requirement ext_release_reference”.
 |
Note
Custom fields and external tracker integrations
If you have opted for the Advanced Reports App: QMetry Insight displays custom fields for the Requirements and Issues modules that are mapped with Jira and Azure, provided Sync Fields to Reports is turned on.
If you have not opted for the Advanced Reports App: QMetry Insight displays those mapped Custom Fields. However, only QMetry Fields data and synced external tracker System Fields data are available for generating reports.
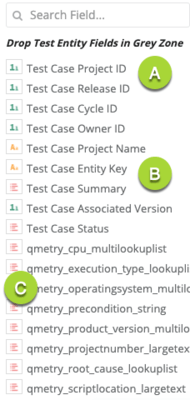
The system displays records only for the latest version of the test asset. For all version data switch to Advanced Query Reports.
 |
Test Run user-defined fields (UDFs)
Test Run UDFs appear in the Executions section, prefixed with Execution qmetry_. For example, a UDF named Severity Level appears as Execution qmetry_severity_level.
You can apply the following operations to Execution UDFs:
Operation | Description |
|---|---|
Column display | Add an Execution UDF as a column in the report layout |
Filters | Filter report results using an Execution UDF value. |
Group By | Group report results by an Execution UDF. |
Sort | Sort report results by an Execution UDF column. |
Math / aggregations | Apply Count, Distinct Count, and other supported aggregation functions |
All supported Visual Report gadget types support Test Run UDFs.
Think Space (Create Data Table)
Think Space is the design area on the right side of the screen. It has three sections:
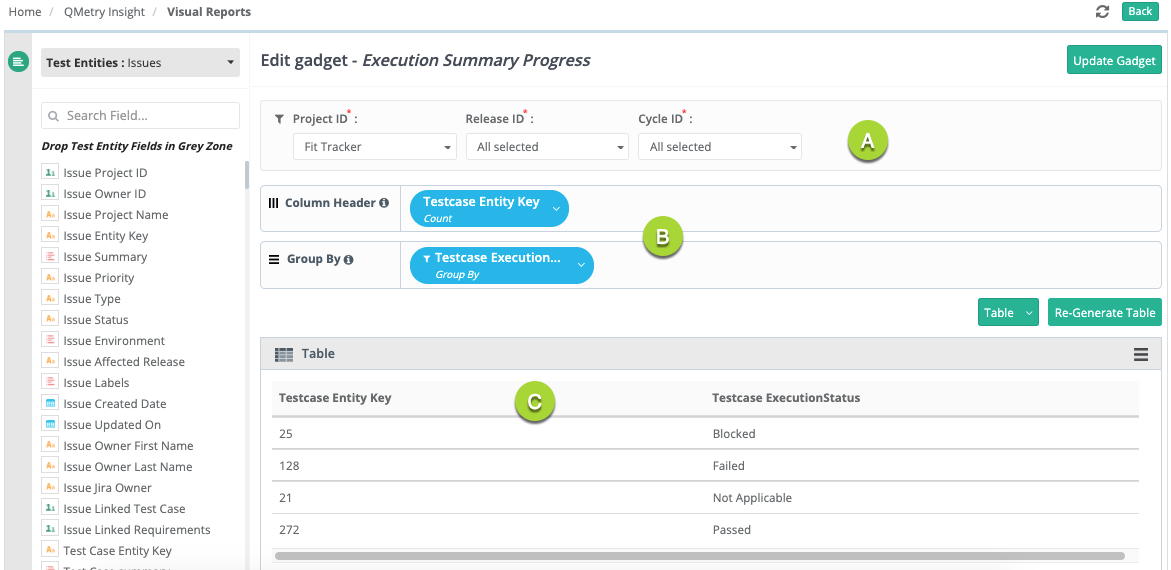 |
Dynamic Filters (A): Narrow report results using dynamic filters.
Report Layout Design (B): Configure columns, groupings, and aggregations that appear in the report.
Result Panel - Generate Report Chart (C): Preview and generate the report chart.
Dynamic Filters
Dynamic filters apply primarily to ID fields such as Project ID, Release ID, and Cycle ID. You can select or deselect all options in the list at once. Add fields using drag and drop.
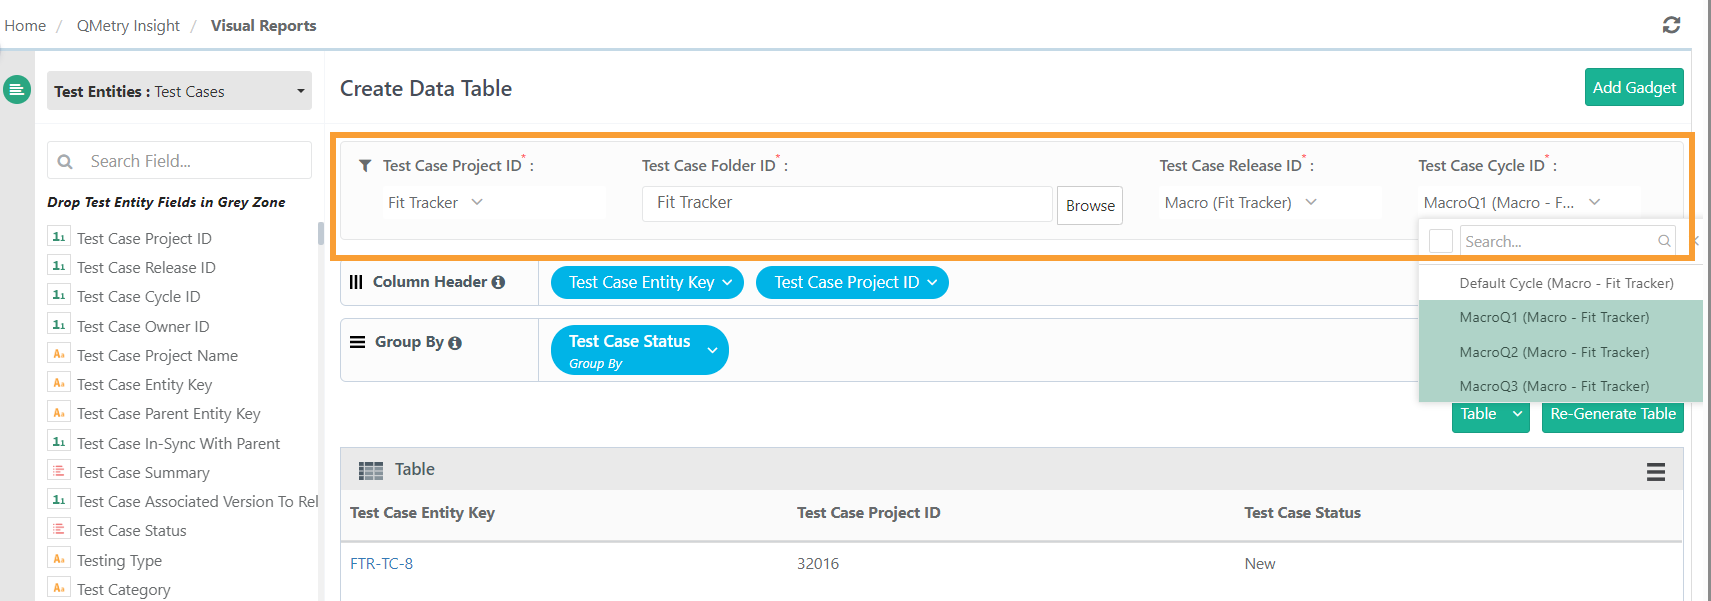
You can also filter by folder structure. This feature is available for Requirements, Test Cases, and Test Suites, and works only when a single project is selected.
The Test Case Folder Path column supports multiple folders. You can view all folder paths linked to each test case. You can also filter test cases using folder IDs or folder paths.
 |
Report Layout Design
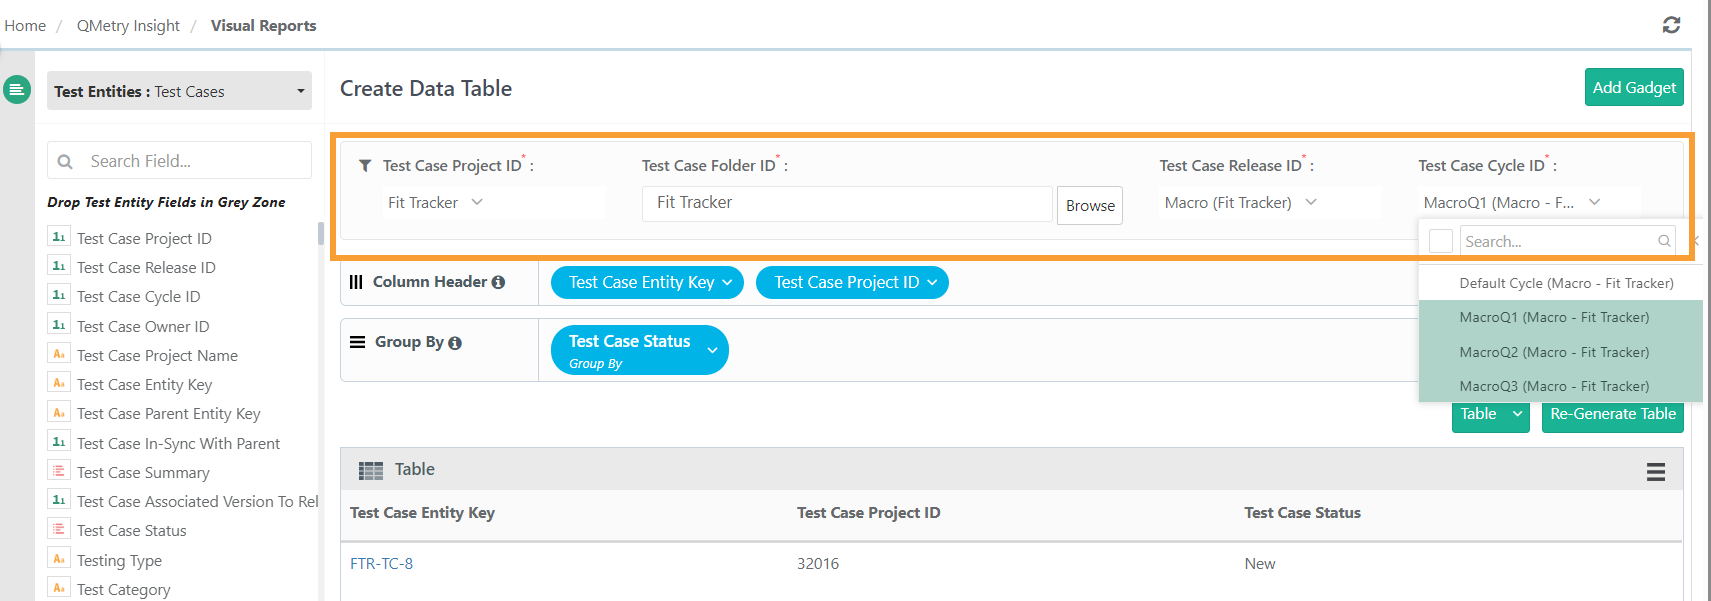
The fields you add in this section appear in the report output. Examples include Execution Status, Test Case Entity Key, Project Name, and Release Name. Add fields using drag and drop or double-click.
The layout section differs for each chart type.
 |
Result Panel
While building a report for the first time, it appears in the Table format. You can converted it to different charts.
On the Result panel, select the report type you want to preview the report. To know more refer to Types of Visual Charts.
Building a Report
To build a report, do the following:
In the Test Entities view, select the module you want to report on.
Drag fields into the Dynamic Filters panel to filter your results by Project ID, Release ID, Cycle ID, or other ID fields.
You can also filter by folder structure. Select Browse to filter by parent or subfolder. This option is available for Requirements, Test Cases, and Test Suites only when a single project is selected.
Drag fields into the Column Header area to set the columns that appear in your report. You can also double-click any field in the Test Entities view to add it.
Drag fields into the Group By area to group results. You can group by custom fields and by system fields of type text, including lookup and multi-lookup fields.
Select Generate Table to preview the report.
To change the chart type, select your preferred type from the Result panel. The system generates all new reports in Table format by default.
Applying Multiple Operations to a Column
You can apply multiple operations — such as Alias, Sort By, Group By, or Math functions — to any field you add to the Column Header. Hover over the field in the Column Header to access these options. For a full list, see Operations on Column Headers.
Handling Uncovered Test Cases
The latest execution status of uncovered test cases is null by default. To display a different value, do the following:
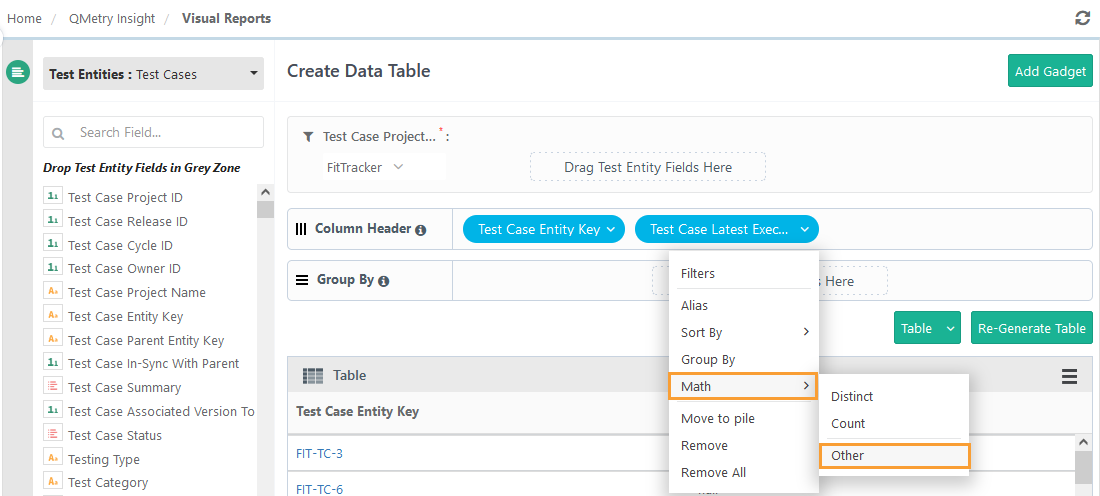
In the Column Header, select the Test Case Latest Execution Status column you added.
Hover over Math and select Other.
On the Logic tab of the dialog box, enter the COALESCE function:
COALESCE (<fieldname>,'<statusvalue>')
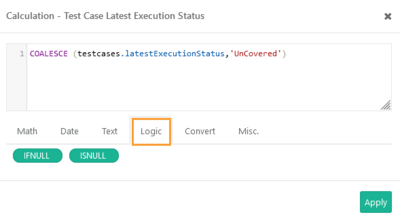
Select Apply.
Saving a Gadget
After you generate a report, you can save it as a gadget and add it to a dashboard. To save a gadget, do the following:
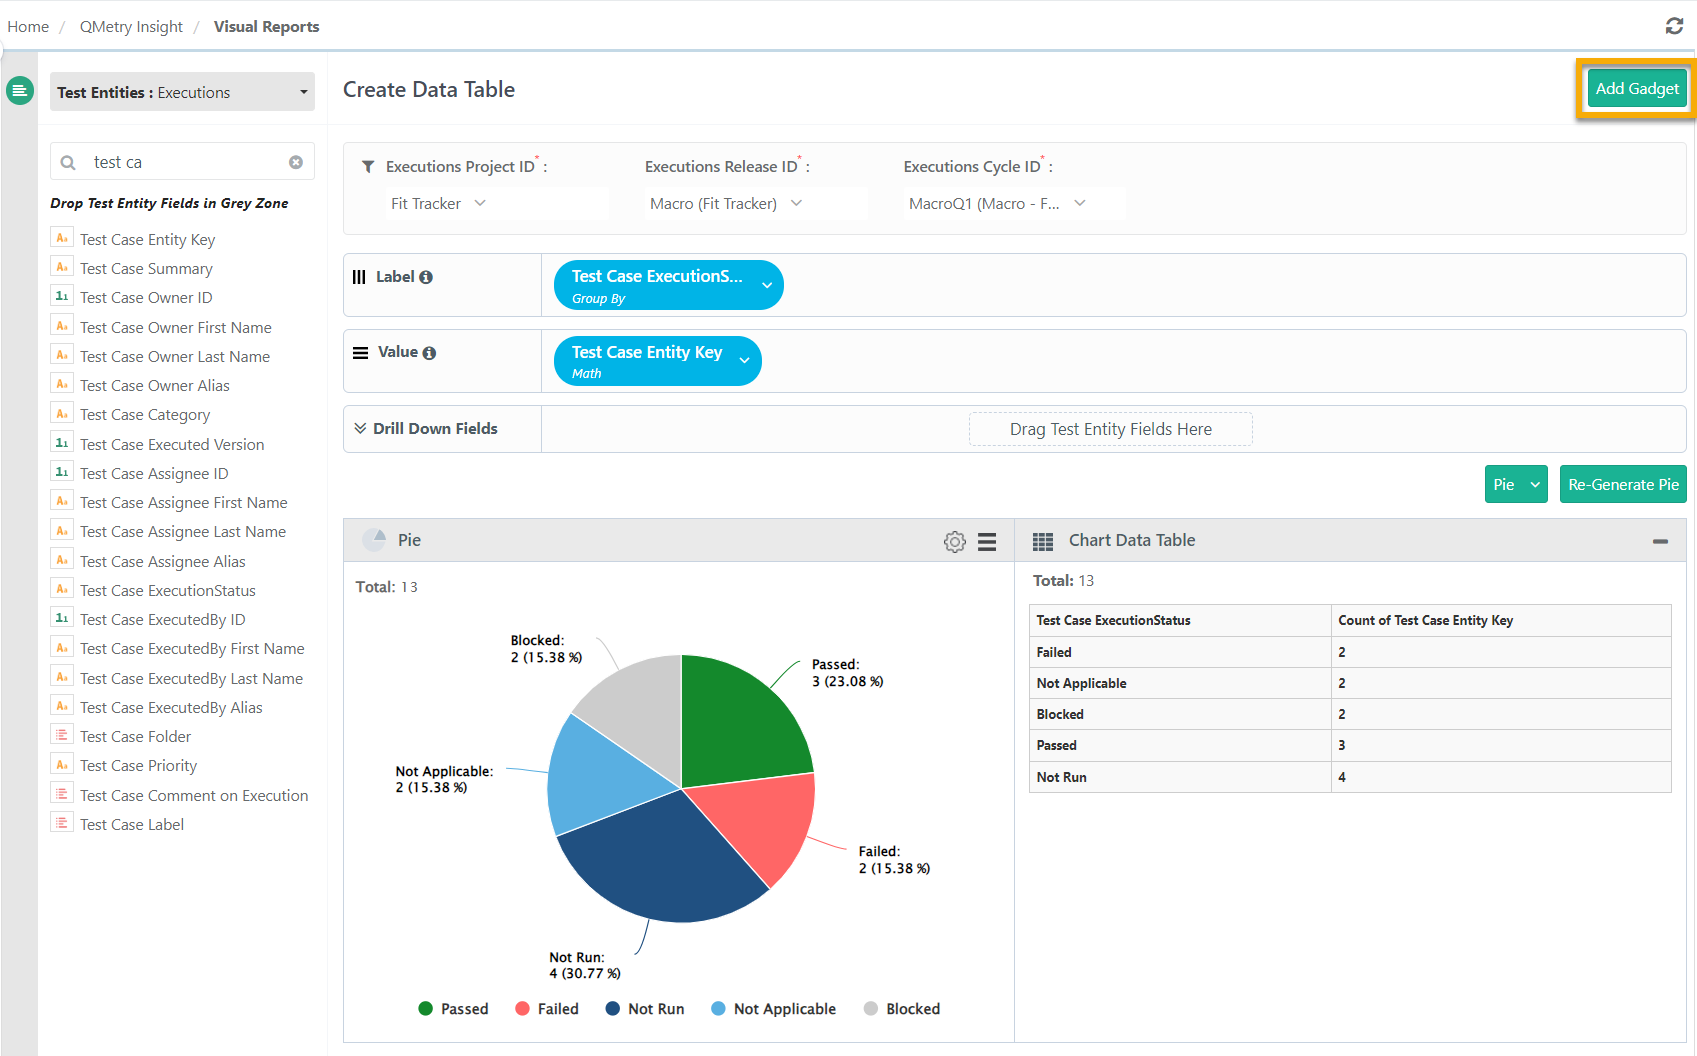 |
Select Add Gadget. The Add Gadget dialog box opens.
Enter a Gadget Name and a Gadget Description.
Select Save.
The saved gadget appears in QMetry Custom Gadget under My Gadget tab.
Customizing Chart Colors
Each chart type includes a Chart Settings icon. Use it to customize the chart's appearance. You can change legend colors and show or hide individual legends.
To customize chart colors, perform the following steps:
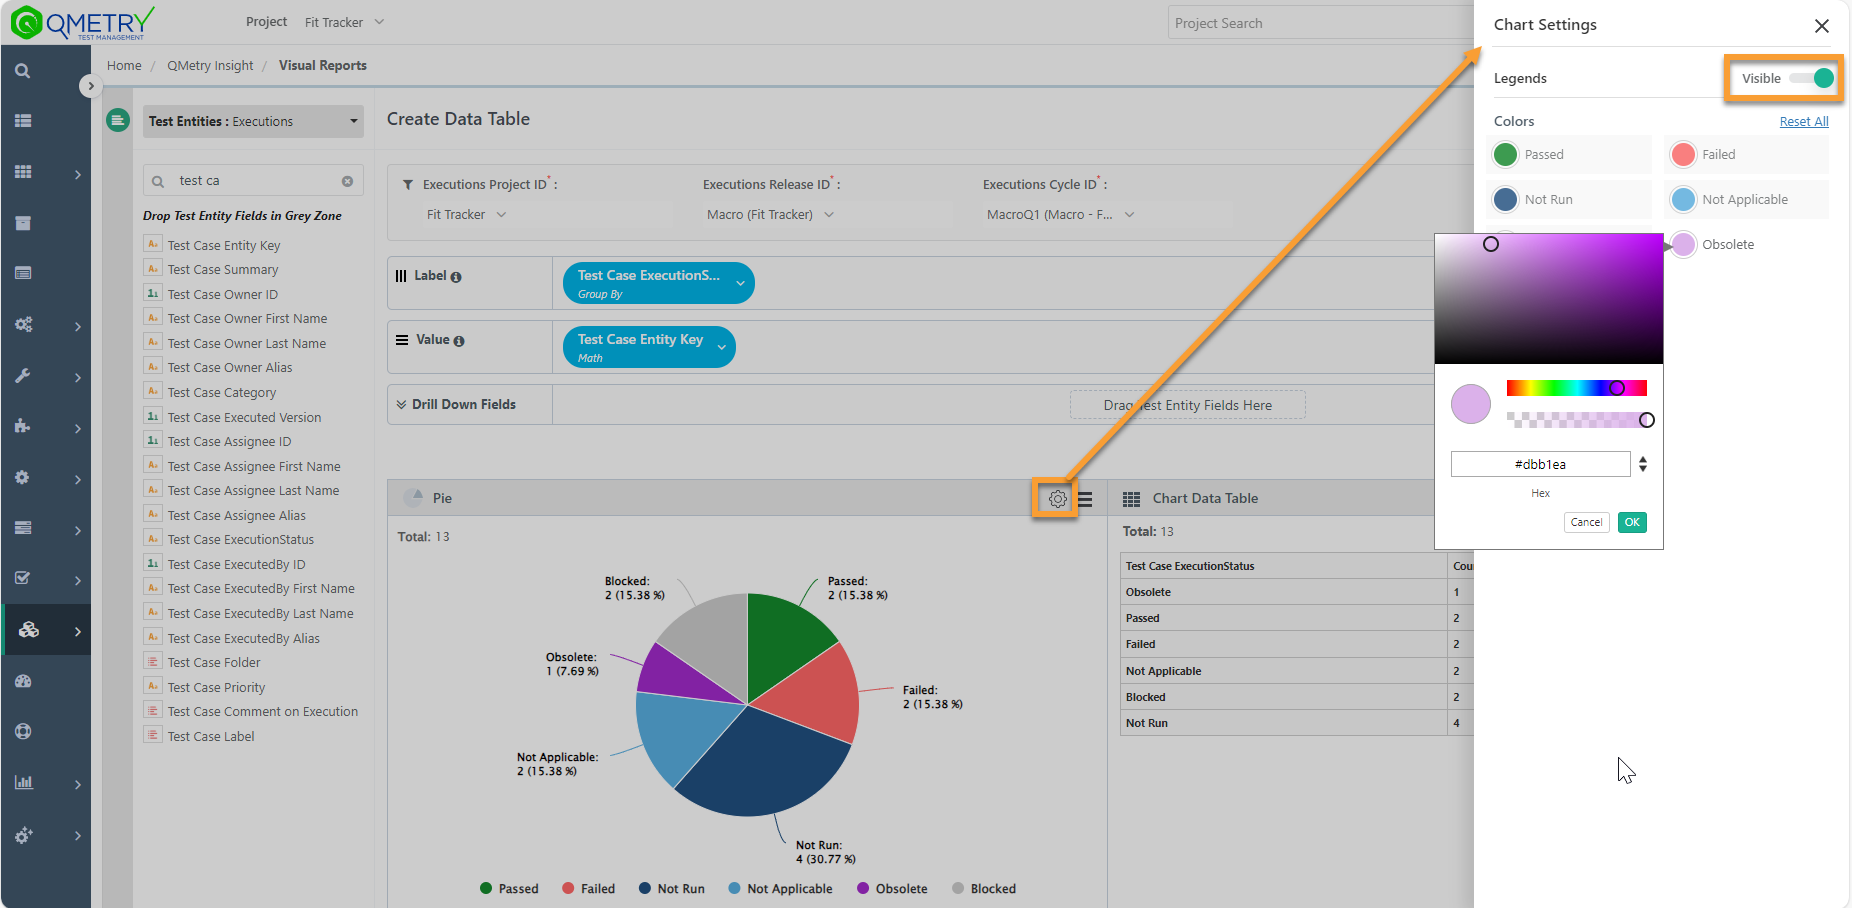 |
Select the cog (⚙️) icon on the graph. The Chart Settings panel opens.
To show or hide a legend on the graph, toggle its Visible setting.
To change a legend color, choose a new color.
Note
You can set the Execution Status legend from Execution Status under Customization. This option is disabled for Execution Status legends
Updating a Gadget
To update an existing gadget, perform the following steps:
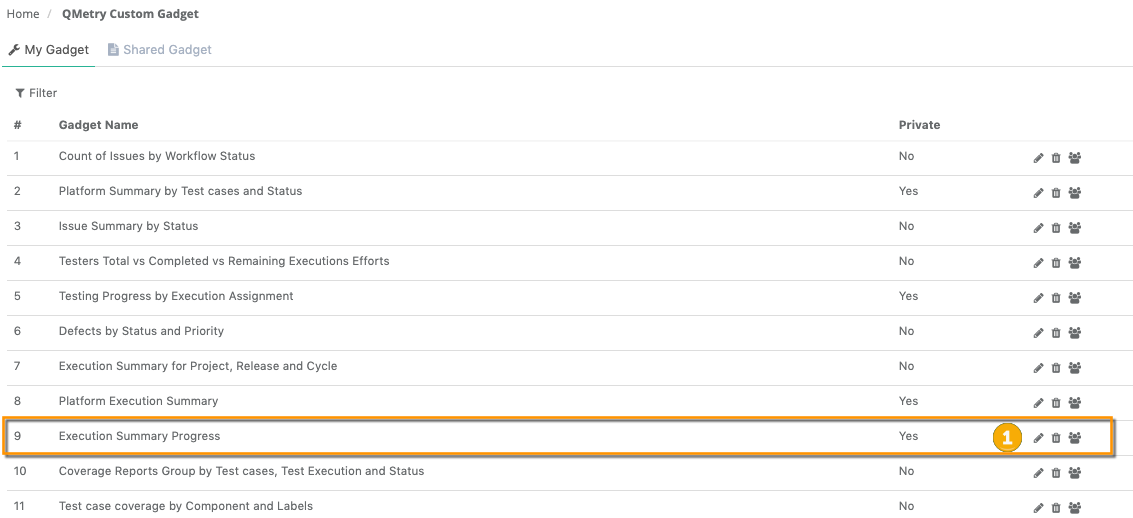 |
Go to QMetry Custom Gadget.
Select the My Gadget tab.
Select the Edit icon for the gadget to update.
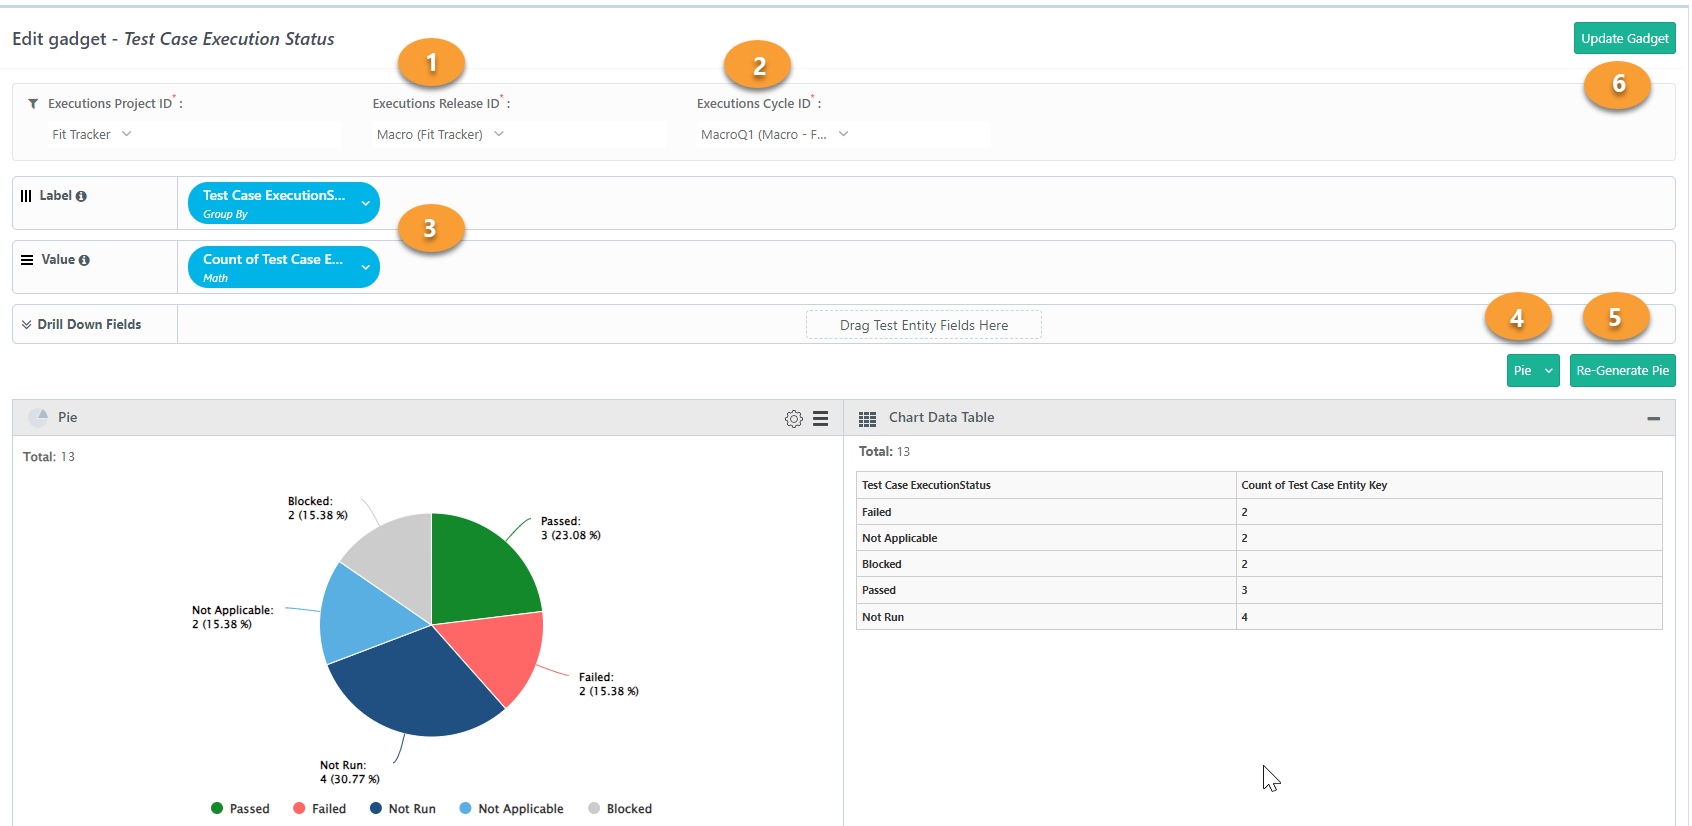
Make your changes. You can update the gadget name, description, filters, columns, Group By settings, labels, operations, and values.
Note
You can apply Group By to custom fields as well as system fields of type text, which includes lookup, multi-lookup, etc. Custom fields include of QMetry custom fields and external tracker fields that are synced to QMetry Insights.
To preview your changes, change the Chart Type and select Re-Generate Table.
Select Update Gadget to save.
Exporting Gadget Data
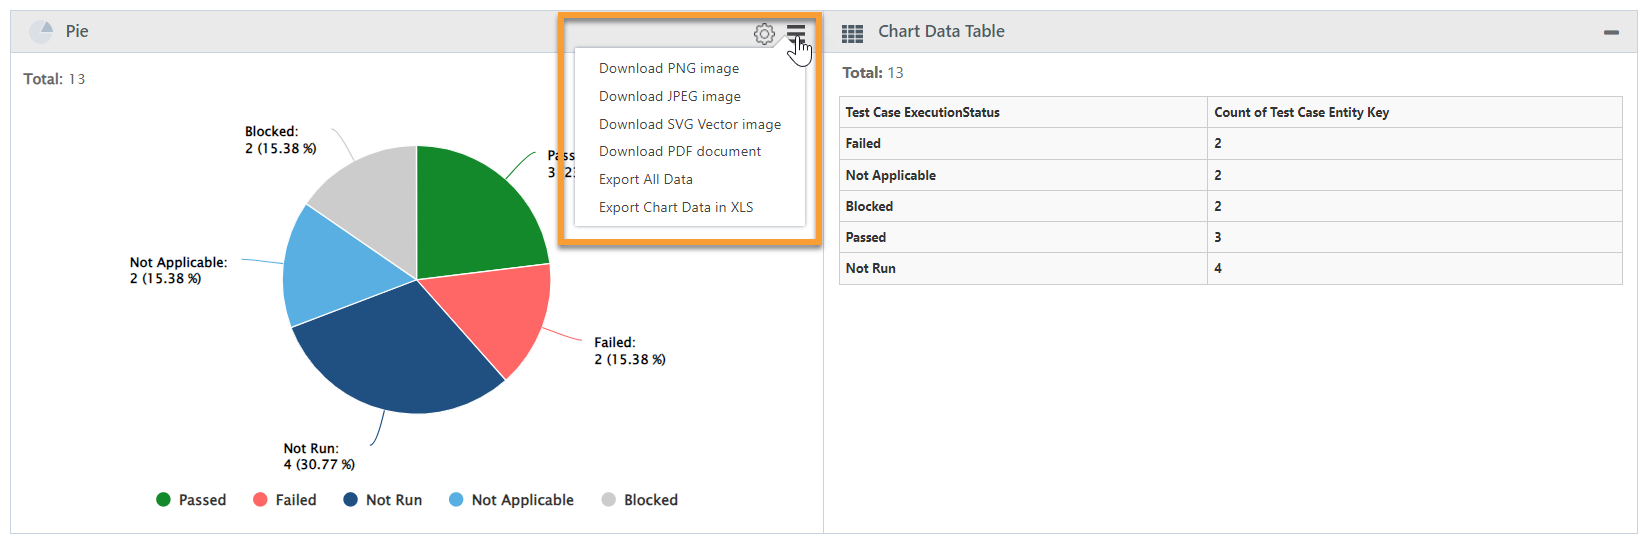
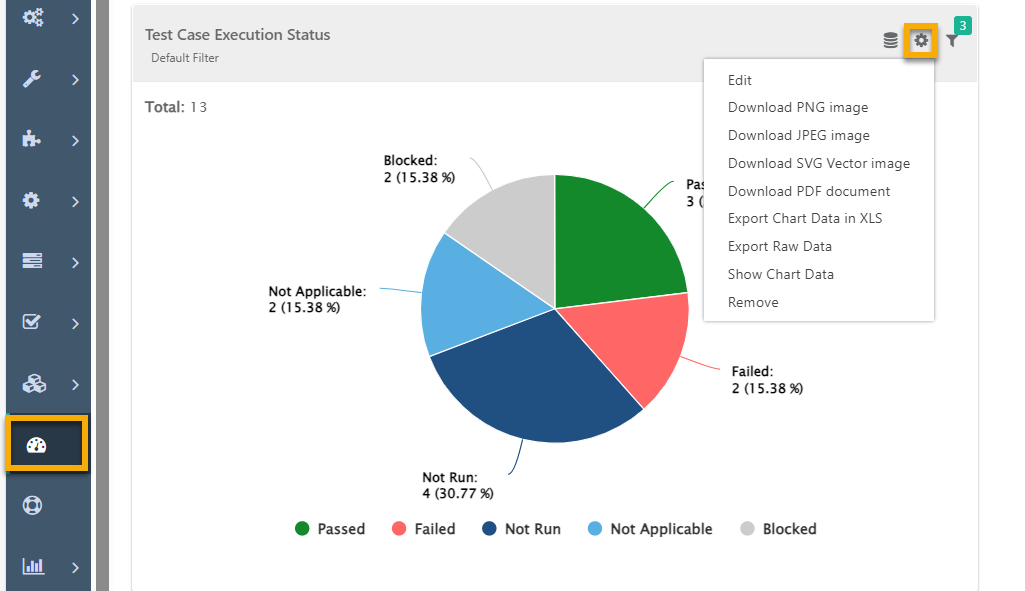
You can export report data in several formats including PNG, JPEG, SVG Vector and PDF formats.
Export All Data: It schedules the Export Report task.
Export column Data in XLS: It downloads the details of Chart Data Table (tabular details) in XLS.
Note
You can export all the dashboard gadgets through API for Reports.
Export from Create or Update Gadget
 |
Export from Dashboard
 |
Export in CSV from Custom Dashboard
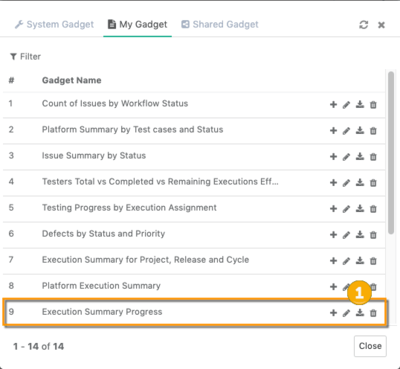
To export gadget data as CSV from the Add Gadget screen, select the download icon next to the gadget in the My Gadget list.
 |
Note
You can see the scheduled job in the Scheduled Task section and download the report in CSV. This is a detailed report.