View Test Case Success Rate
The Success Rate is a quality indicator that QMetry calculates for each test case, based on the settings configured in the QMetry Intelligence module. It reflects the pass rate of a test case across its executions and helps QA managers and testers gauge how reliably a test case passes.
You can view the Success Rate in several places across the application: the Test Case list view, the test case detail page, the Link Test Cases screen, and the Test Execution screen. This topic explains how to display and interpret the Success Rate in each location.
Note
Whenever the Success Rate settings are changed in the QMetry Intelligence module, resets the existing Success Rate values and recalculates them using the new settings.
Pre-requisites
Before you begin, ensure the following conditions are met:
The Success Rate settings are configured in the QMetry Intelligence module.
You have access to the Test Case module or the Test Execution module.
Track Success Rate
You can view the Success Rate from the following locations:
Screen | Actions available |
|---|---|
Test Case list view | View the calculated percentage for every test case, then sort, filter, and open the traceability report. |
Test case detail page | View the generated Success Rate next to the test case key at the top of the page. |
Link Test Cases screen | Show or hide the Success Rate column while linking test cases. |
Test Execution screen | Compare results across executions, and drill down to related executions and defects. |
Filter Test Cases on Success Rate
You can filter the test cases by success rate under the Advanced Filters.
View the Success Rate on the Test Case list view
The Test Case list view displays the Success Rate for each test case. To display the column, do the following:
Go to the Test Case module.
Open the column settings for the list view, and select the Success Rate column to make it visible.
About the Success Rate
The system calculates the Success Rate based on the pass rate of a test case. The Success Rate column provides the following details and actions:
Displays the calculated success percentage for each test case.
Allows you to sort test cases to view those with the highest success rates.
Clicking the Success Rate value opens a Traceability Report, which shows the test case’s association with test executions, issues, and execution results. This helps analyze the Success Rate further.
An information icon beside the column displays the details of when the Success Rate was last generated and by whom.
If you change the Success Rate Settings, the existing Success Rate values are reset.
Analyze the Traceability Report
When you select a Success Rate value, QMetry opens the traceability report for the test case. This report shows the test executions, issues, and execution results that the test case is associated with, so that you can analyze the Success Rate in more detail.
View Success Rate on Test Case Detail Page
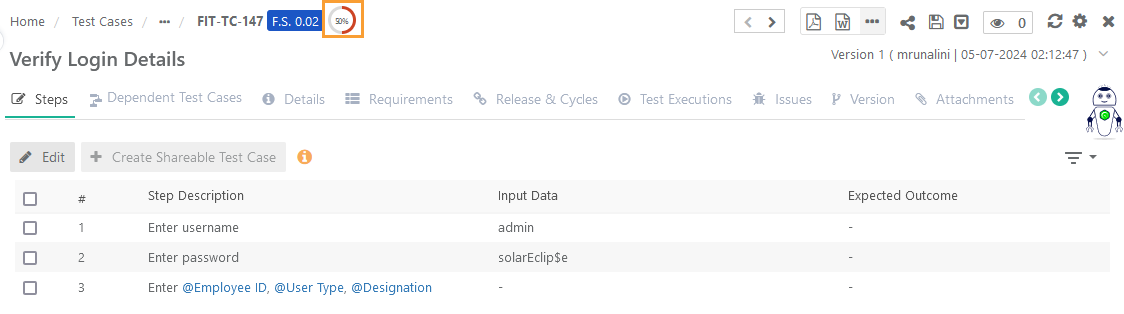
The test case detail page displays the generated Success Rate next to the Test Case Key at the top of the page. To view it, open any test case from the Test Case list. The Success Rate appears as a badge beside the key, giving you the pass rate at a glance while you review the test case steps, requirements, and executions.
 |
View Success Rate on Test Case Link Screens
You can show or hide the Success Rate column on the Link Test Cases screen. Displaying the column while you link test cases helps you take each test case's pass rate into account before you associate it with a requirement, execution, or other entity.
View Success Rate on Test Execution Screen
On the Test Execution screen, QMetry calculates the Success Rate from the settings configured in the Configuration module and displays it accordingly. Go to the Test Execution screen to view the Success Rate in either of the following views.
Test Execution Detail View
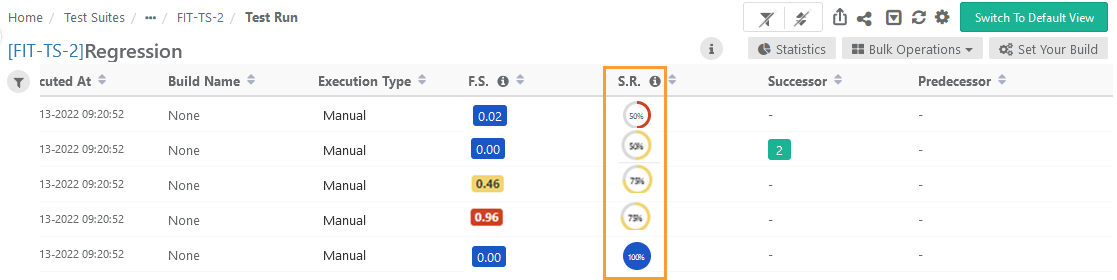
The detail view displays the success rate (S.R.) column alongside the Flaky Score (F.S.) for each run. When you open a run in the detail view, you can view the Success Rate count at the top of the page.
 |
Test Execution Default View
In the default view, you can show or hide the Success Rate column on the execution screen. To analyze a value in more detail, select the Success Rate to drill down to the test executions and defects that are associated with the test case.