QMetry System Reports
Note
QMetry System Reports module is visible only if you have View rights for Report. You can make changes within the module only if you have the Modify rights for Report.
QMetry System Reports are default built-in reports designed according to globally recognized QA best practices. The System Reports offer valuable insights to help teams monitor and evaluate testing performance, efficiency, and outcomes.
Global Filters
The System Dashboard supports Global Filters, allowing you to view and apply common (i.e. shared) filters across all gadgets directly from the top of the dashboard. Instead of configuring filters for each gadget individually, you can set shared filters that apply to all gadgets.
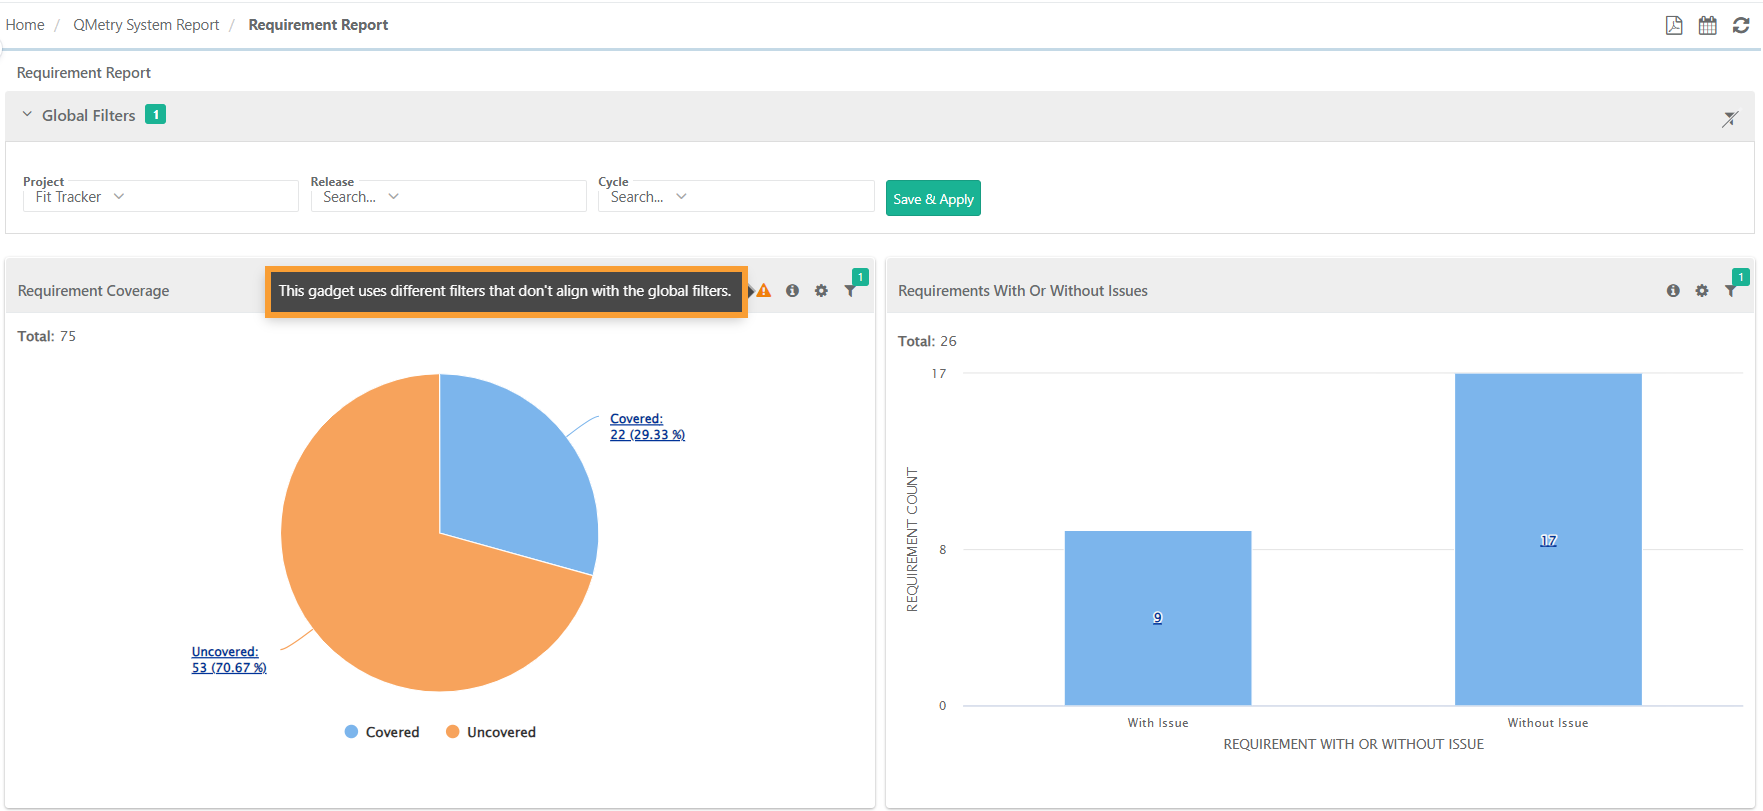
However, you still have the flexibility to configure unique filters for individual gadgets. If the global filters differ from those set on the gadget, the system displays an indication.
Note
Only filters that are common across all gadgets added to a dashboard appears in the Global Filter section.
If a user accesses the dashboard via an embedded URL without co-owner permissions, the user can only view common dashboard filters with the applied settings and do not have the ability to modify the filters.
Here’s how Global Filters Function:
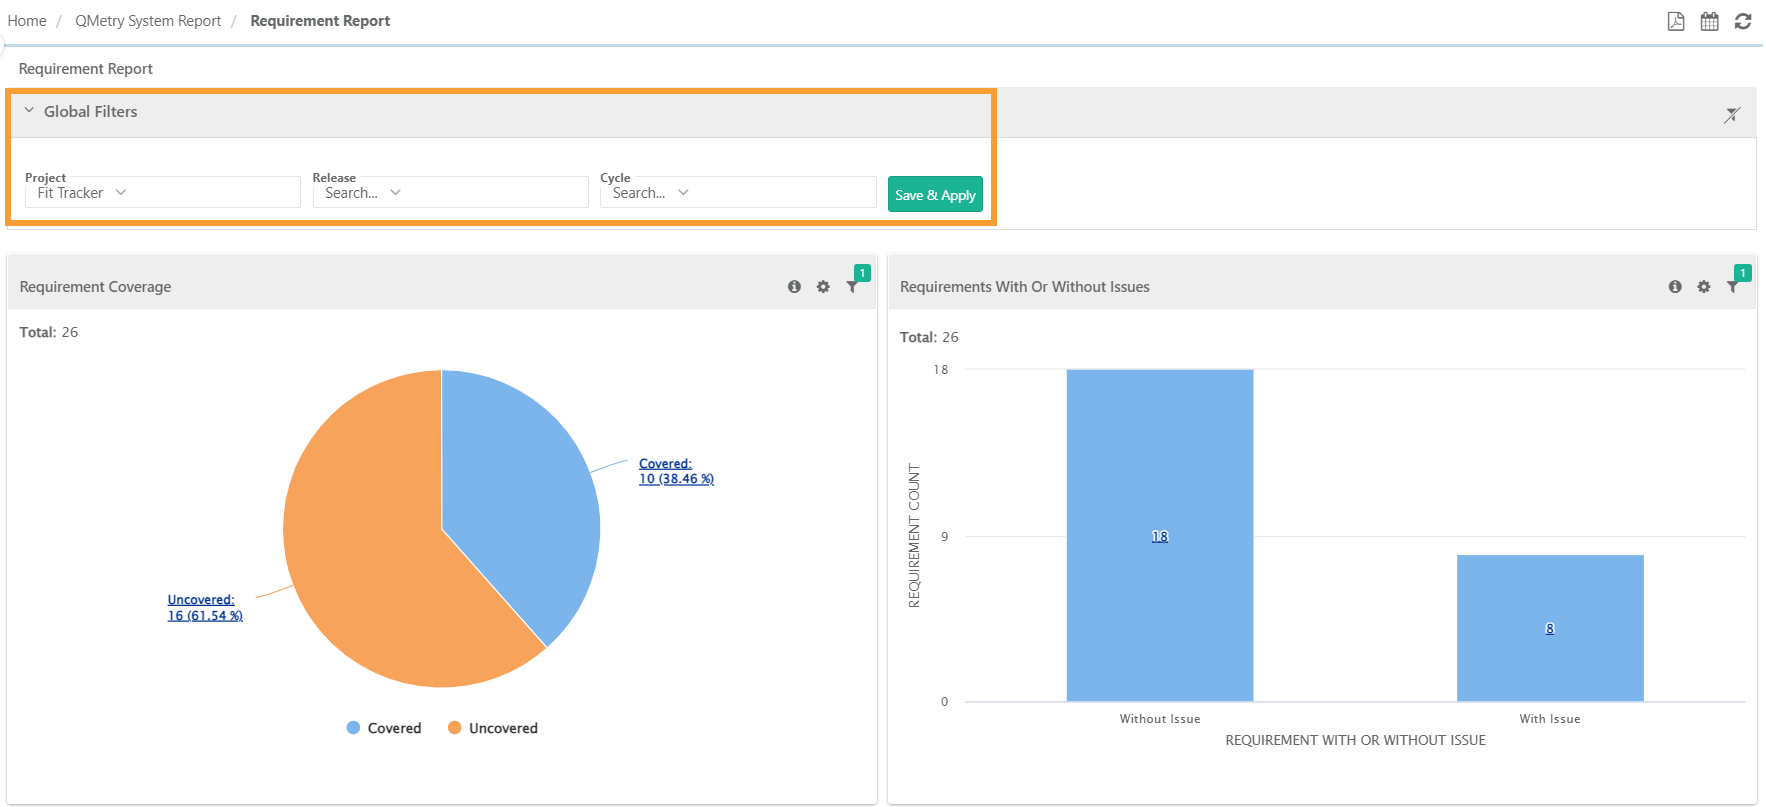 |
When you apply a global filter, it overrides the current filters on all gadgets.
Any previously applied filters at the gadget level that are not part of the common Global Filter are not retained. You must manually reselect those filters if needed.
You can edit the global and unique filters at the gadget level.
You can save global or unique filters based on their preferences.
You can select only one project at a time if a folder-level filter is available in the global filters section.
 |
Messages for Filter Configuration
If you modify the Common filter field values at the gadget level and they differ from the Global filter field values, a badge appears at the gadget level displaying the message: "This gadget uses different filters that don't align with global filters."
If no common filters are shared across the gadgets on the dashboard, the message "There is no common filter available across all gadgets" appears on the screen in place of the global filters.
Icons on the QMetry System Reports
Each Gadget has the following options on it:
Icons | Description |
|---|---|
| Indicates when the gadget is using filters that differ from the global filters. |
| Offers a brief overview of the gadget. |
| Allows users to download or export the gadgets. |
Enables users to apply filters to the reports. The filters applied on the reports can be viewed on hover over the filter icon in the gadget. The filter count is also displayed. |
Export System Reports and Gadgets
Export System Reports as PDF
To export the entire report containing all charts to PDF, click on the PDF icon located in the report header.
The exported report reflects the details based on the filters applied during report generation. Filters applied to the charts will also be displayed above individual charts in the exported PDF.
When exporting the full report to PDF using the "Export as PDF" option at the top, the report includes data (either graphical or tabular) according to the preferences set for the report.
Export Gadgets
| Click the Cog icon and you have multiple options to download and export the individual gadget details. 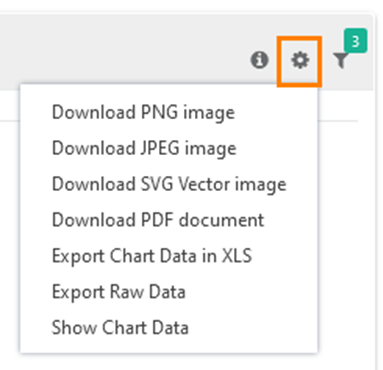 |
Download PNG image | This option is valid for graphical reports like bar chart, pie chart, column chart, etc. The report will be exported in PNG format. |
Download JPEG image | This option is valid for graphical reports like bar chart, pie chart, column chart, etc. The report will be exported in JPEG format. |
Download SVG image | This option is valid for graphical reports like bar chart, pie chart, column chart, etc. The report will be exported in SVG format. |
Download PDF document | This option is valid for graphical reports like bar chart, pie chart, column chart, etc. The report will be exported in PDF format. |
Export Chart Data in XLS | The report data will be exported in tabular form. |
Export Raw Data | The report displays data using which the graph has been generated. |
Show Chart Data | The option displays report data in tabular form in the same gadget panel. The view (Graph/Tabular) you select for the report is preserved for it until you change the view. 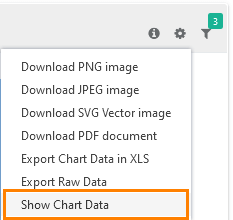 The data is displayed in the tabular format like below. To go back to Graph view, click on Back to Chart. |
Export of Drilled Down Chart | You can view the tabular format of the graphical representation. You can drill down the chart by clicking on the required portion/bar of the chart. It displays the details in table - rows and columns. To download the report in CSV, click on the download icon at top right. Then check the Scheduled Task section from where you can see the progress and download the report. |
Schedule System Reports
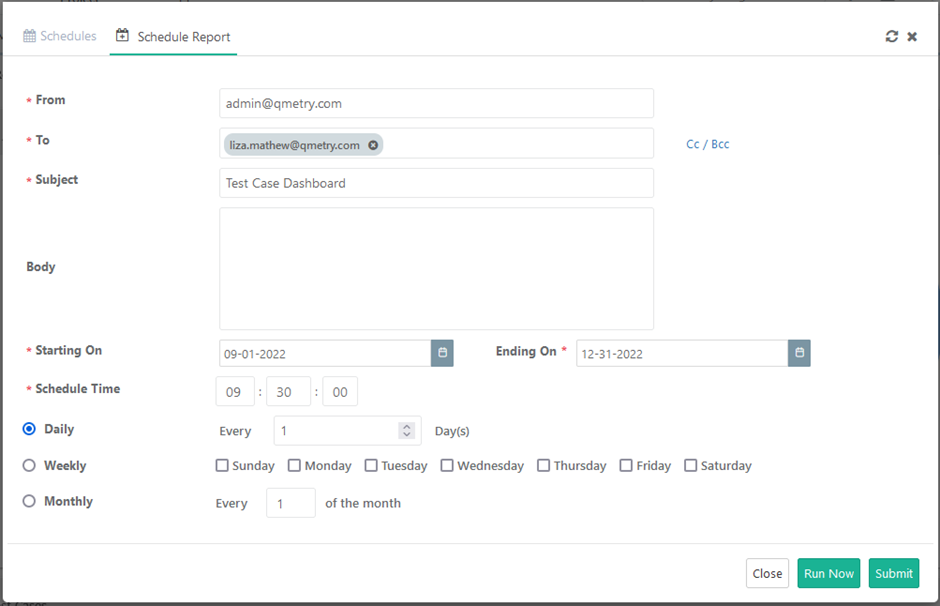
You can schedule system reports as one time or recurring email notifications. To schedule outbound emails at a particular frequency, click Schedule for the report that you want to share.
The system sends the report details in PDF to recipients as per the defined schedule. The PDF containing graphical as well as tabular reports are emailed using Scheduled Report.
The scheduler icon is provided on the report header. Clicking this icon opens a screen with the two tabs:
Schedules: The tab shows a list of scheduled reports.
Schedule Report: Template to schedule reports.
Note
The following system reports cannot be scheduled:
Top Issues Report
Traceability Report
Test Result Log Report
Platform Report
Release Cycle Report
Scheduling System Reports
To schedule system report emails, perform these steps:
Open the Schedule Report tab.
Enter the details and provide the email addresses.
Schedule the emails and click Submit.
The system sends the report as per the set date, time, and frequency.
To send the email instantly, click Run Now.
 |
Scheduled Reports
Once you schedule the reports, the system displays it on the Schedules tab. You can edit and delete the schedules.
Refresh Reports
QMetry System Reports are not auto-refreshed when opened for a longer duration. To refresh the reports manually, click Refresh. It syncs the data to render the reports with latest data.
Manage Jira Fields Visibility in System Gadgets
Note
When integrating Jira projects into QMetry through the Projects, integration screen, users with project modification rights, can hide certain fields for security reasons.
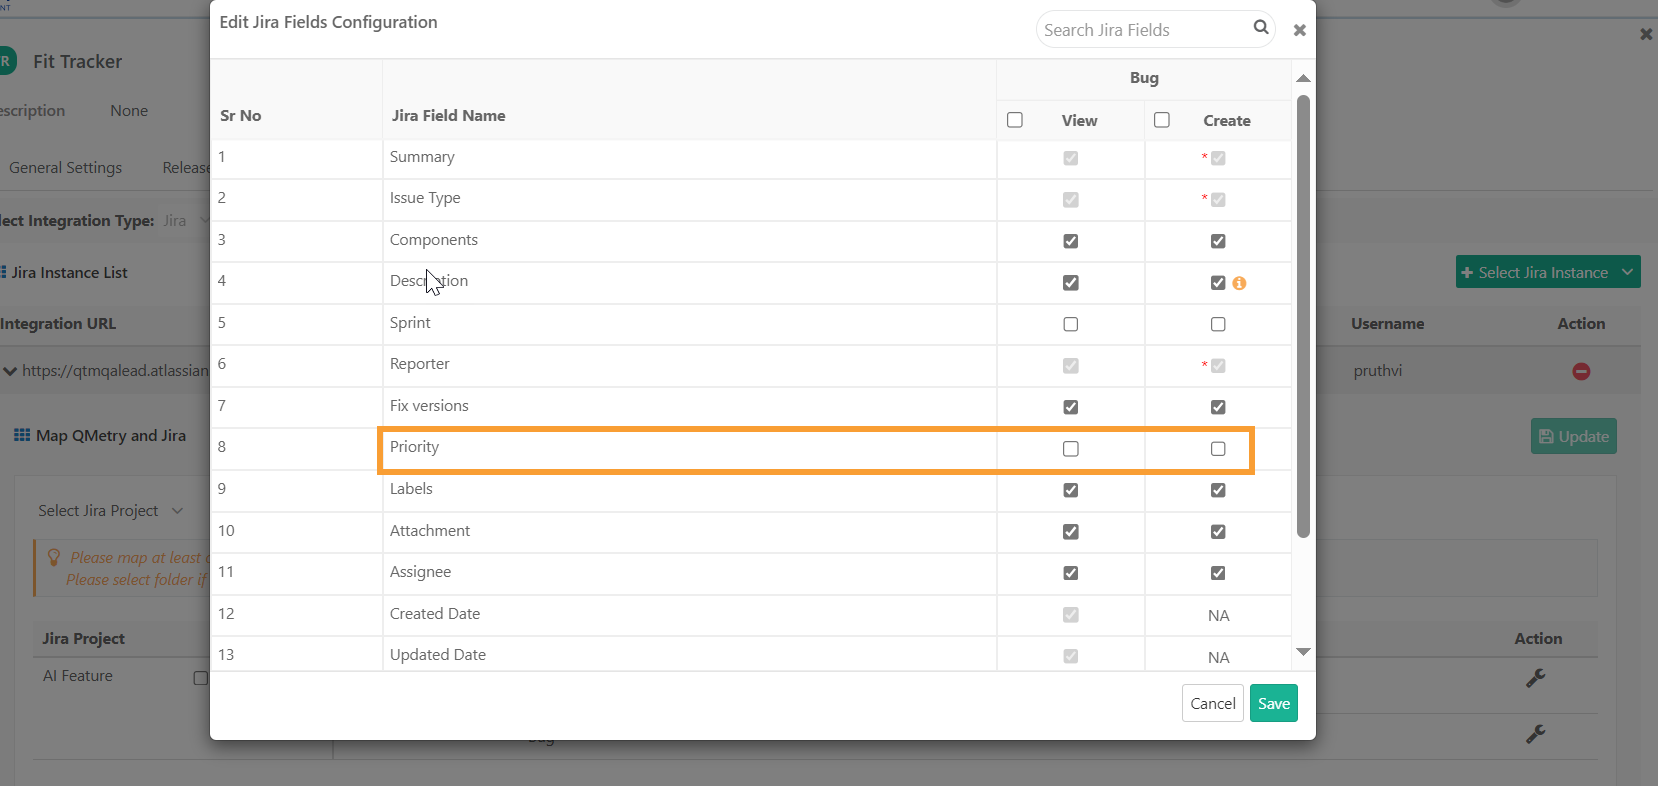 |
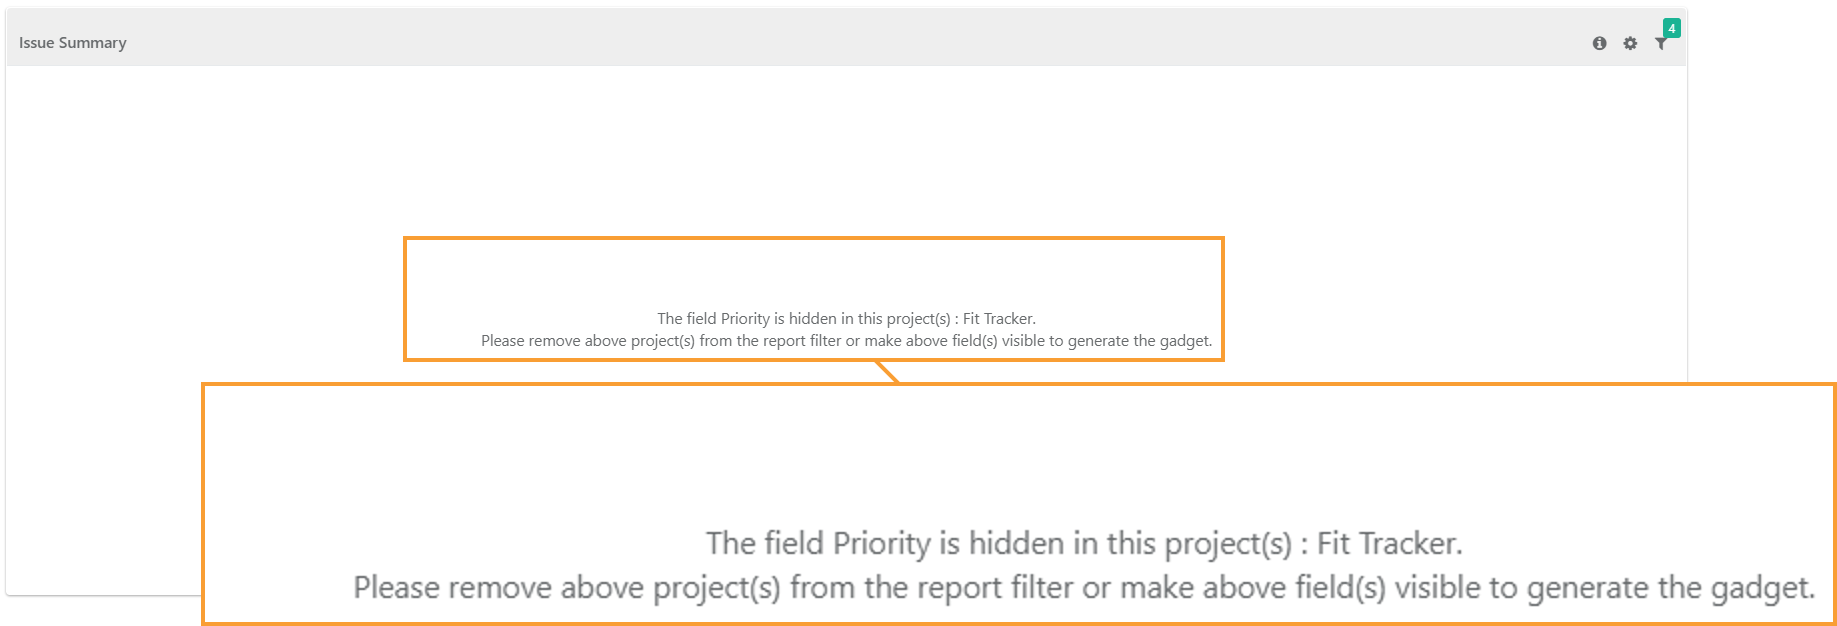
If a Jira field is marked as hidden, the system doesnot display any report gadgets containing that field. This is to ensure data confidentiality. The system sends a message notifying about the field’s visibility settings.
 |
The system reports affected by a Jira field’s visibility status include:
My Dashboard: Issues Count, Uncovered Requirements
Requirements Report: Requirement Coverage, Requirements with or without Issues, Planned Requirements, Requirement Summary
Issue Analysis Report: Issue Summary, Issue Count by Status & Priority, Issue Velocity Compared to Requirements, Resolved Issue Verification, Issue Velocity compared to Test Cases executed report
Top Issues Report: Top Issues Report
Execution Summary Report: Issue Summary
Manage Jira Fields Visibility in Tabular System Reports
In tabular system reports, if you use a hidden external field in the gadget filter, the system dies not display the report and data. It sends the same notification as above.
If the hidden field is not part of the filter but appears as a column in the gadget, you can view the report data. However, the hidden column is displayed as "not mapped for syncing." Please note that this only applies to tabular gadgets.
For example, if the admin hides the 'label' field in the Projects > Integration screen.
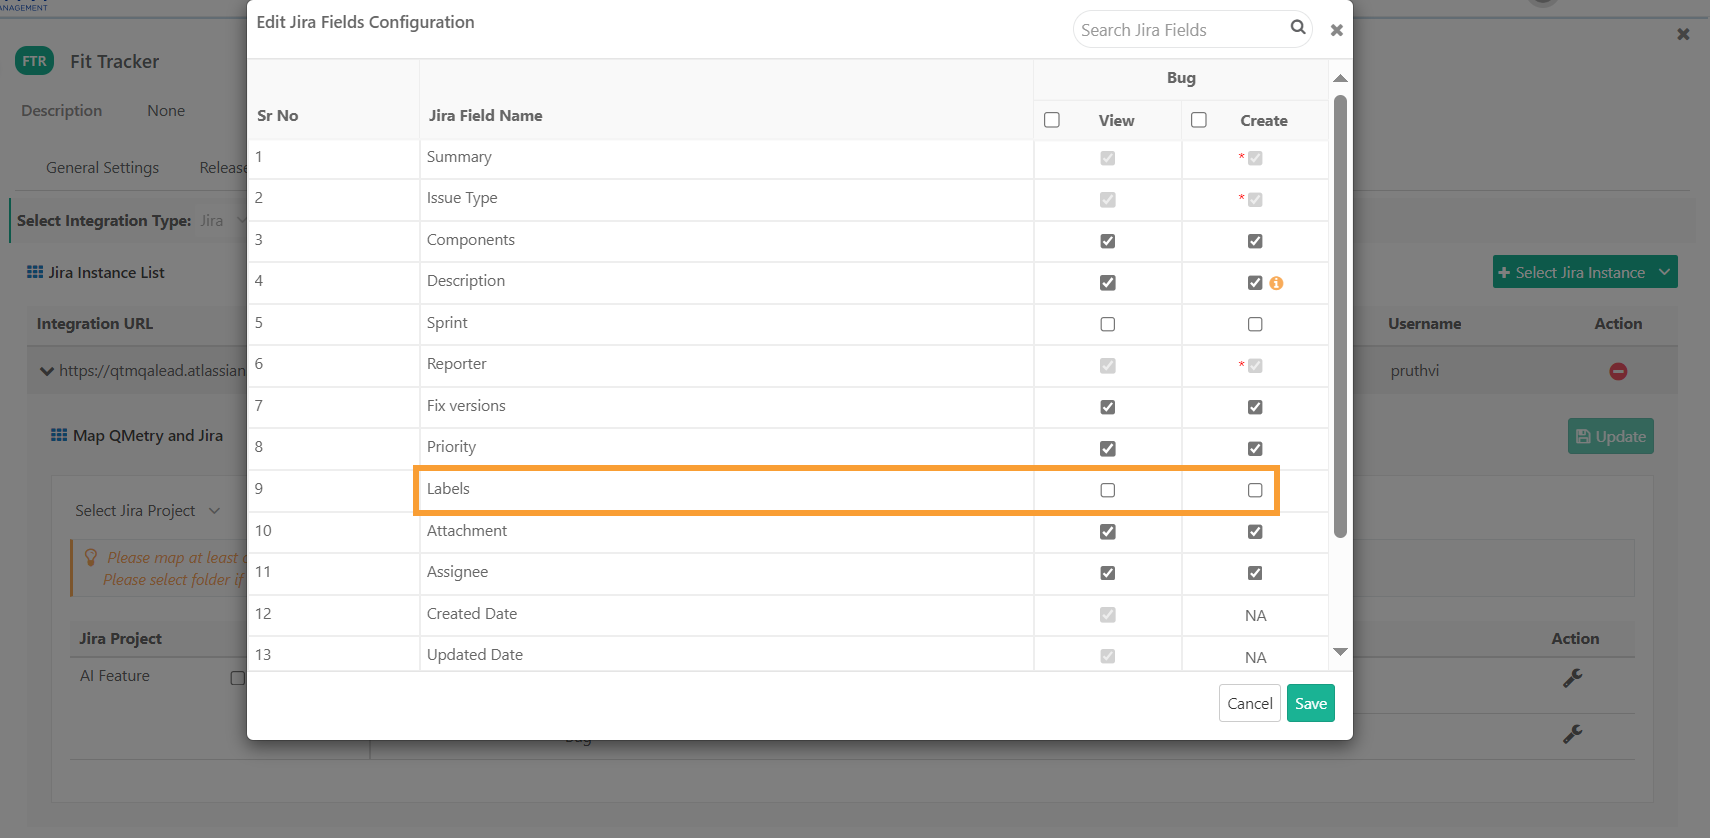 |
The 'label' field is not available as a filter option for the Top Issues Report.
The column value shows "not mapped for syncing." This happens because the 'label' field is not included as a filter for this report.
 |


